Rippability is the ease with which soil or rock can be mechanically excavated. According to Bieniawski, rippability of rock is assessed by numerous parameters including uniaxial strength, degree of weathering, abrasiveness, and spacing of discontinuities. Nevertheless, seismic refraction has historically been the geophysical method utilized to indirectly predetermine the degree of rippability.
Ripping is typically performed by tractor-mounted equipment. The size of the tractor (dozer) is determined by the ripping assessment of the rock. The hardness and competency of each individual material will determine the ease of rippability. Rock that is too hard to be ripped is fragmented with explosives.
Rocks can be classified into three categories: igneous, sedimentary, and metamorphic. Igneous rocks, formed by cooling of molten masses originating within the earth, are the most difficult to rip. This is partly because they lack lines of weakness such as stratification or cleavage planes. Metamorphic rocks are generally defined as any rocks derived from pre-existing rocks by mineralogical, chemical, and/or structural changes, in response to marked changes in temperature, pressure, shearing stress, and chemical environment. Common metamorphic rocks are gneiss, quartzite, schist, and slate. These rocks vary in rippability, depending on their degree of stratification or foliation.
Sedimentary rocks consist of material derived from the destruction of preexisting rocks. Water action is responsible for the largest percentage of sedimentary rocks, although some are formed by wind or glacial ice. Sedimentary rocks are generally the most rippable.
Few or no problems are found with hardpan, clays, shales, or sandstones. Likewise, any highly stratified or laminated rocks, and rocks with extensive fracturing are usually rippable.
The physical characteristics that are favorable for ripping are given below:
- Frequent planes of weakness such as fractures, faults, and laminations.
- Weathered rocks.
- Rocks with moisture permeating the formations.
- Highly stratified rocks.
- Brittle rocks.
- Rocks with low "shear strength."
- Rocks with low seismic velocities.
Conditions that make ripping difficult are as follows:
- Massive rocks.
- Rocks with no planes of weakness.
- Crystalline rocks.
- Non-brittle energy absorbing rock fabrics.
- Rocks with high "shear strengths."
- Rocks with a high seismic velocity.
The above rippability criteria are presented by The Caterpillar Company in a book titled Handbook of Ripping.

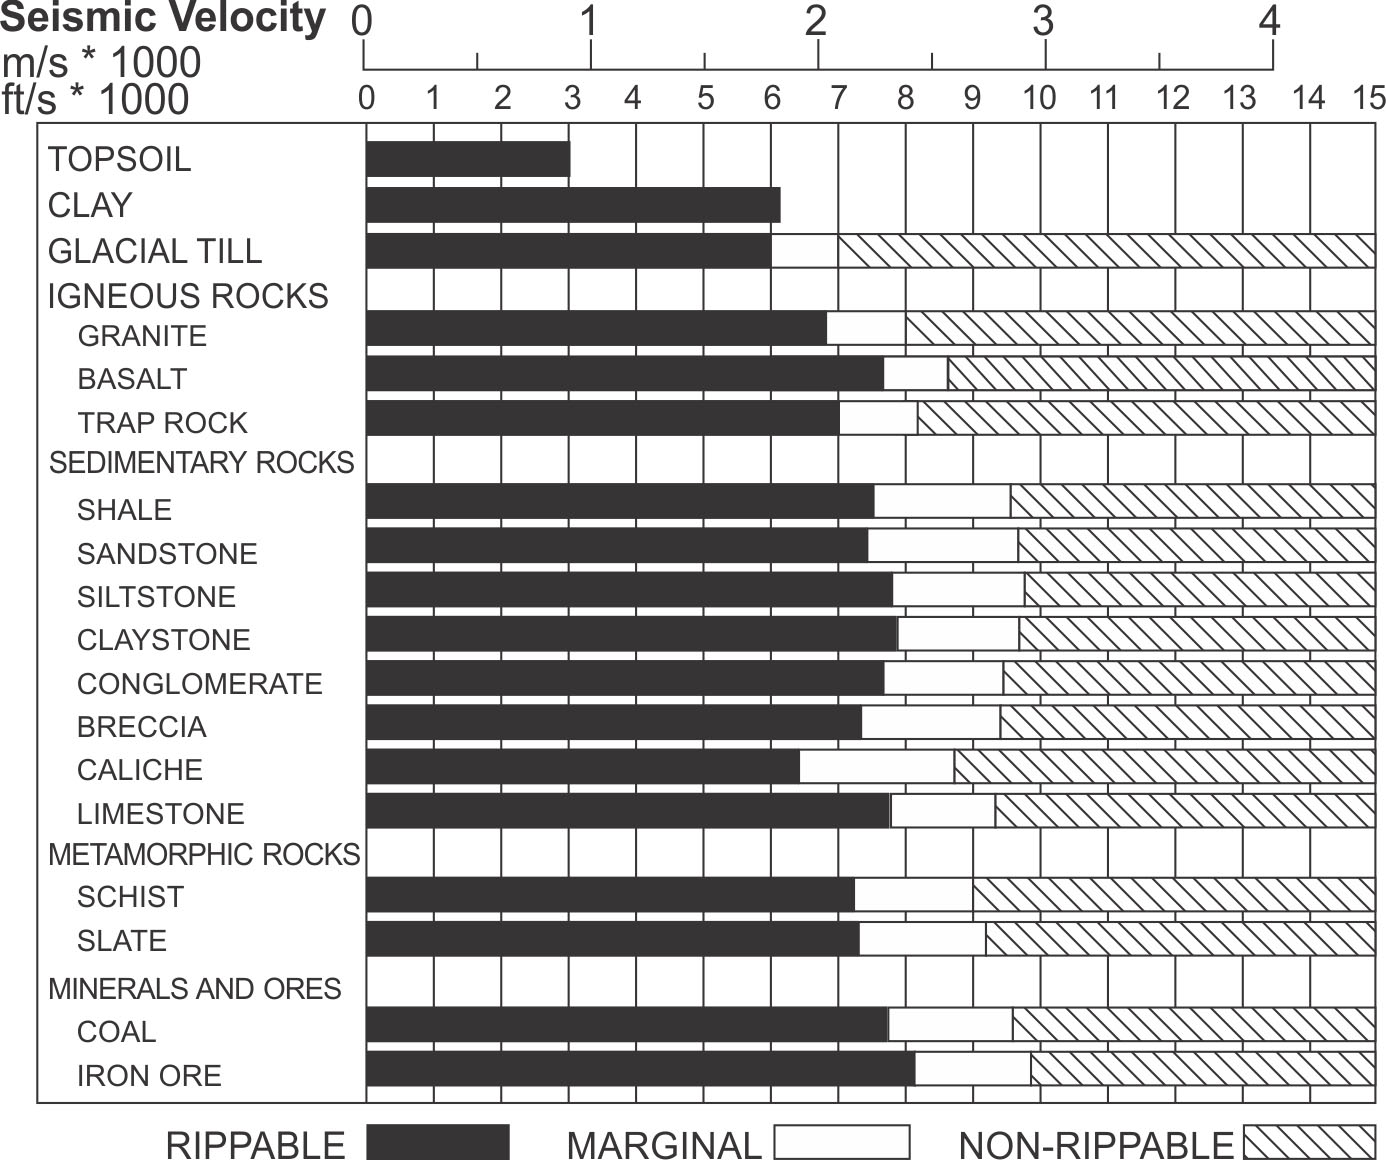
Figure 177. Rippability versus seismic velocity. (Caterpillar. Handbook of Ripping, 8th Edition)
Figure 177 shows the rippability of various rock types for different seismic velocities using a D9 Caterpillar tractor. As can be seen, when the seismic velocity is more than 2,000 m/s, the D9 tractor is insufficient, and a larger tractor will be required. A D11 tractor can rip some rocks with velocities of almost 3,000 m/s.
Seismic Refraction
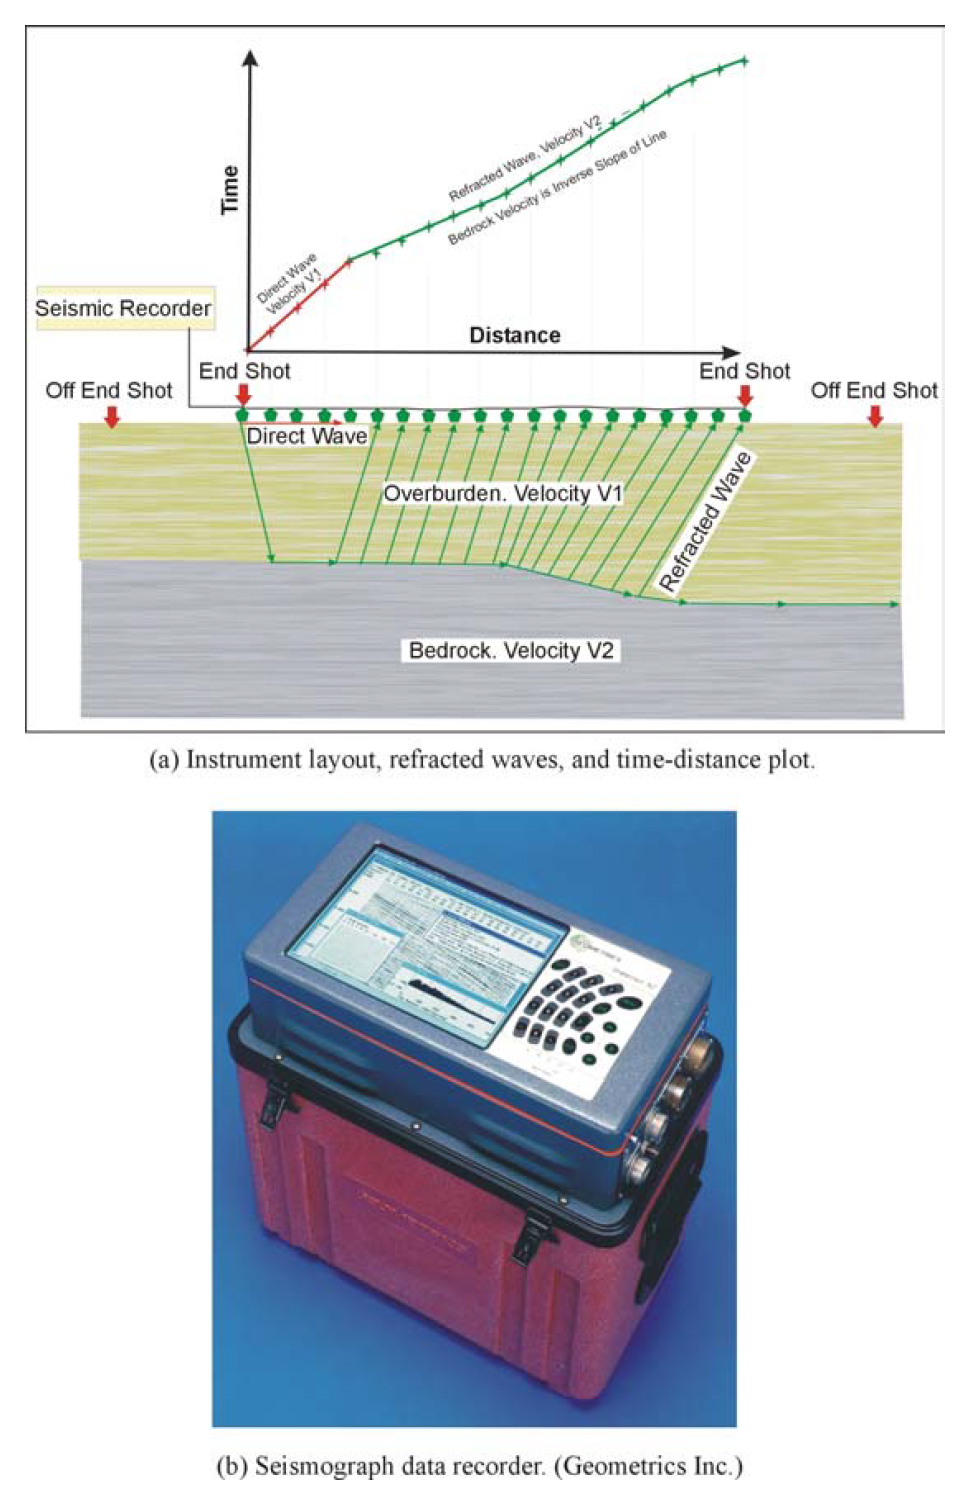
Basic Concept: The seismic refraction method can be used to find rock velocities. The method requires a seismic energy source, usually a hammer for depths of less than 15 meters and explosives for depths to 30 meters. The seismic waves then propagate through the overburden and refract along the bedrock surface. While they are traveling along this surface, they continually refract seismic waves back to the ground surface. These refractions are then detected by geophones placed on the ground surface. Figure 114a shows the layout of the instrument, the geometry of the seismic refraction procedure, and the corresponding time-distance graph that is used in data processing.

Figure 114. Seismic Refraction: field set up and data recorder.
Data Acquisition: The design of a seismic refraction survey involves (1) location of survey, (2) geophone spacing, and (3) the spread (cable length). Surveys should be recorded on days with little wind, away from traffic and other sources of noise and vibrations. If unwanted energy received on site is minimal, the true waveform may be captured employing larger energy sources and filtering and/or stacking the received signals. In addition, since some of the noise travels as airwaves, covering the geophones with sound- absorbing material (partially filled sandbag) may help dampen unwanted noise and enhance coupling of the geophones to the ground.
In general, refraction spreads need to have a length at least three times the desired depth of investigation, which, if investigating to depths of 20 meters, will be 60 meters. If a 24 channel seismic system is used, a geophone spacing of 3 meters, giving a spread length of about 70 meters, will be sufficient, and will also provide velocities for shallower bedrock layers. Both refractor depth and velocity can be obtained from the seismic data. Generally, geophones having a natural frequency of less than about 10 Hz will be used.
Data Processing: The first step in processing/interpreting refraction seismic data is to pick the arrival times of the signal, called first break picking. A plot is then made showing the arrival times against distance between the shot and geophone. This is called a time-distance graph. An example of such a graph for two-layered ground (overburden and refractor) is shown in figure 114a.
The red portion of the time distance plot shows the waves arriving at the geophones directly from the shot. These waves arrive before the refracted waves. The green portion of the graph shows the waves that arrive ahead of the direct arrivals. These waves have traveled a sufficient distance along the higher speed refractor (bedrock) to overtake the direct wave arrivals.
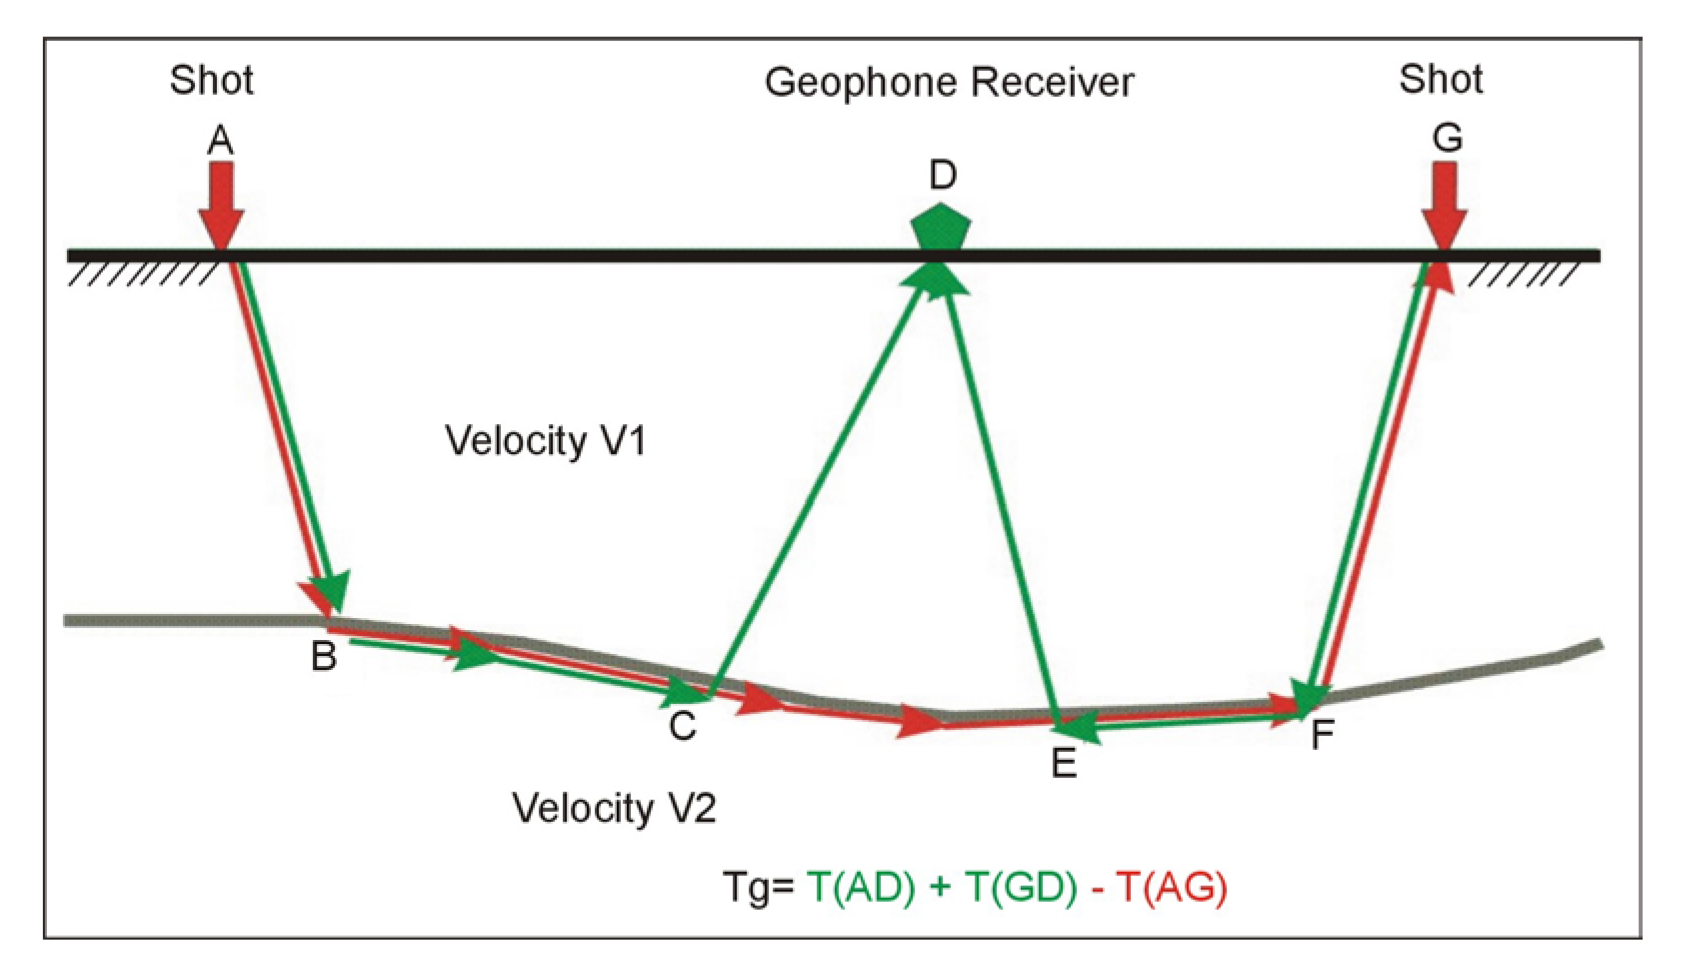
Data Interpretation: The velocity of the refractor and overburden are immediately available from the slope of the time-distance lines. The depth to the refractor can be obtained using several methods. One of the most common methods is called the Generalized Reciprocal Method (GRM) that is described in detail in the Geophysical Methods section. A brief, and simplified, description of the GRM method is presented below. Figure 115 shows the basic rays used for this interpretation. A full GRM interpretation can also provide more detail about the velocity of the refractor, or refractors.

Figure 115. Basic Generalized Reciprocal method interpretation.
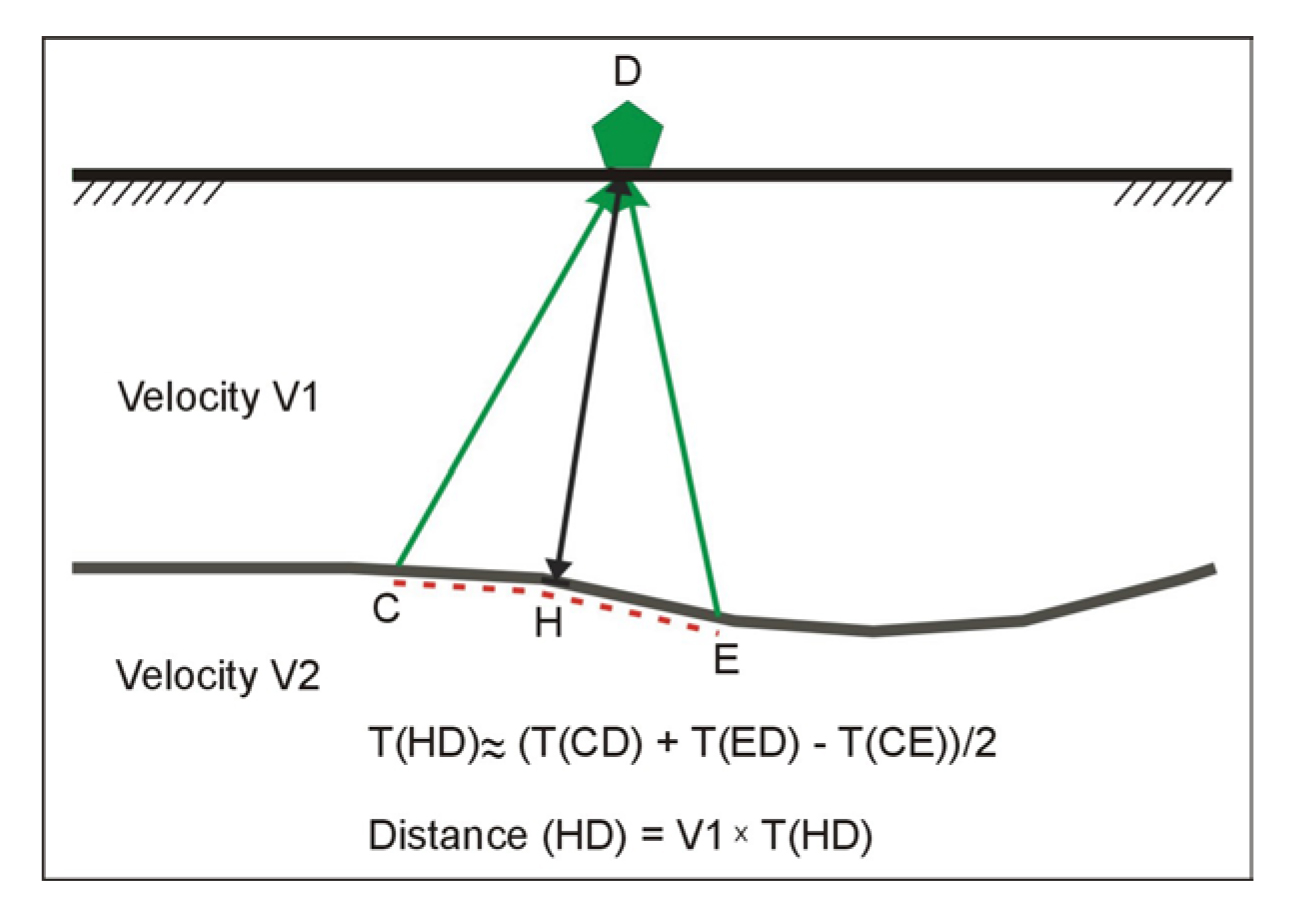
The objective is to find the depth to the bedrock under the geophone at D. This is done using the following simple calculations. The travel times from the shots at A and G to the geophone at D are added together (T1). The travel time from the shot at A to the geophone at G is then subtracted from T1. Figure 116 shows the remaining waves after the above calculations have been performed. These are the travel times from C to D added to the travel times from E to D subtracting the travel time from C to E. The sum of these travel times can be shown to be approximately the travel time from the bedrock at H to the geophone at D. Since the velocity of the overburden layer can be found from the time-distance graph, the distance from H to D can be found giving the bedrock depth.

Figure 116. Generalized Reciprocal method interpretation.
Advantages: The refraction seismic method is probably the best and most field efficient method for determining the velocity of the bedrock.
Limitations: The seismic refraction method takes advantage of a common occurrence; seismic velocities increase as a function of depth. In other words, the underlying strata, represented by V2 in figure 114a, is assumed to provide a higher seismic velocity than the overlaying layer, represented by V1. This is an important assumption when utilizing the seismic refraction method because "first arrivals," the fastest seismic velocity measured at each geophone, are the only ones considered when data are processed.
If this assumption is false, then no critical refraction occurs at the V1 - V2 interface. This would lead to an overestimate of the thickness of the V1 layer by including the thickness of the V2 layer as "part" of the V1 layer thickness. This dilemma is known as the "hidden layer" problem. Since the velocity of the overburden and refractor are obtained from the slope of the line on the time-distance plot, geological investigations (i.e., borings from wells) would be required to detect the hidden zone.
If seismic velocities do not increase with depth, as in weathered zones where hard lenses may occur, then problems may occur. This will depend on the thickness and extent of the hard lens, along with its velocity contrast with the surrounding material. The thickness of the hard lens will have to be greater at greater depths in order to be a problem. The thickness of a layer depends on the seismic wavelength to influence the seismic refraction data. However, a one-meter-thick hard lens 10 meters deep will probably not be observed. For localized lenses, these may be recognized during the interpretation since, if refractions are emanating from the hard lens, the bedrock may suddenly appear shallow. In addition, the rock velocity may change.