Geophysical methods can be used to determine engineering properties of rocks. These include the Bulk Modulus, Young's Modulus, Shear Modulus, and Poisson's ratio, collectively called the elastic constants of a rock. The density of rocks can be estimated from seismic velocity. Porosity and permeability are more difficult to determine, although a relatively new method called Nuclear Magnetic Resonance (NMR) has provided some promising results. Degree of saturation, or percent of the pore space filled with water is mentioned in the literature for soil surveys using the Ground Penetrating Radar (GPR) method.
To determine the elastic constants, the shear wave and compressional wave velocities have to be measured. The elastic constants can be calculated using the equations given below.
 (7)
(7)
where

 (8)
(8)
or
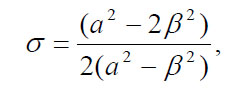 (9)
(9)
 (10)
(10)
 (11)
(11)
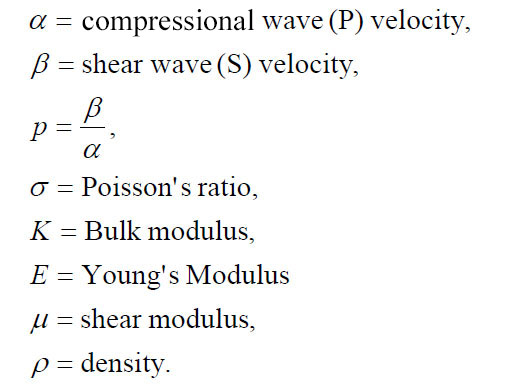
where
Shear and Compressional Wave Velocities
To calculate the above quantities, the shear (S) and compressional (P) wave velocities have to be measured. For relatively shallow surveys, say less than 30 m deep, seismic refraction surveys can be used to measure these quantities. The data recording for the two surveys is very similar, the only difference being the source for the seismic energy.
Compressional wave sources include a hammer and base plate, black powder or other explosive, or a vibrator truck that puts energy into the ground using a base plate that vibrates at specified frequencies. Shear wave energy is more difficult to produce. One method of putting shear wave energy into the ground is to put a long piece of wood on the ground and hold it to the ground by placing the wheels of a vehicle on top of the wood. Shear waves are then created by using a hammer to impact the sides of the wood. Various other shear wave sources are available. One of these devices is the Microvib (figure 95). This is a small portable shear wave generator that uses vibration rather than impact techniques. Shear waves can also be created using conventional truck vibrators. However, these are usually used only when deep investigations are required.
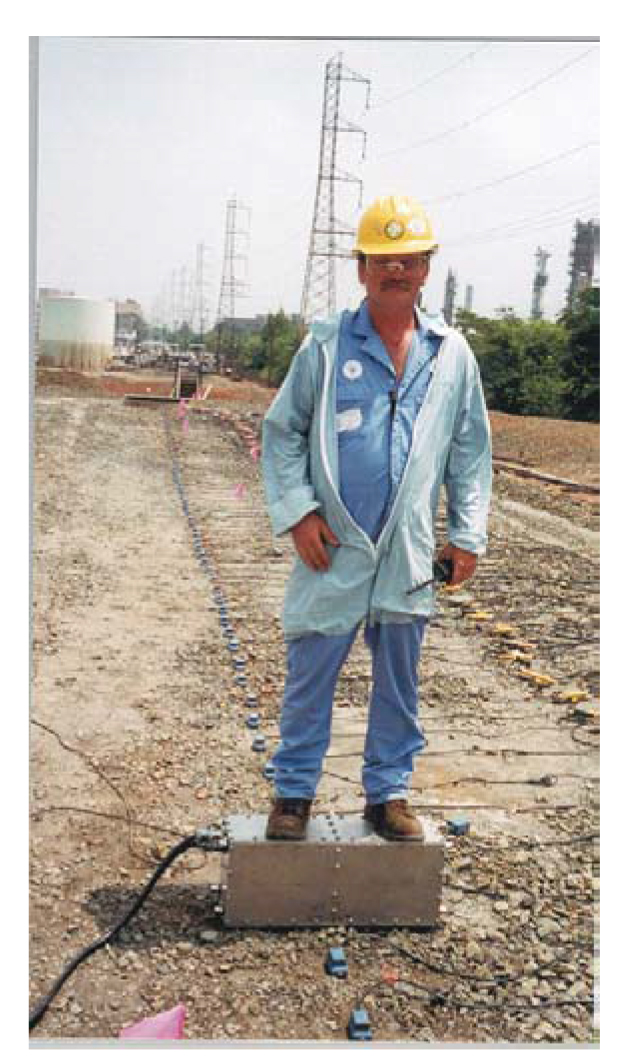
Figure 95. The Microvib shear wave generator. (Bay Geophysical)
The data are recorded using a seismic recorder with geophones that detect the vibrations. A typical seismic recorder is shown in figure 114b.
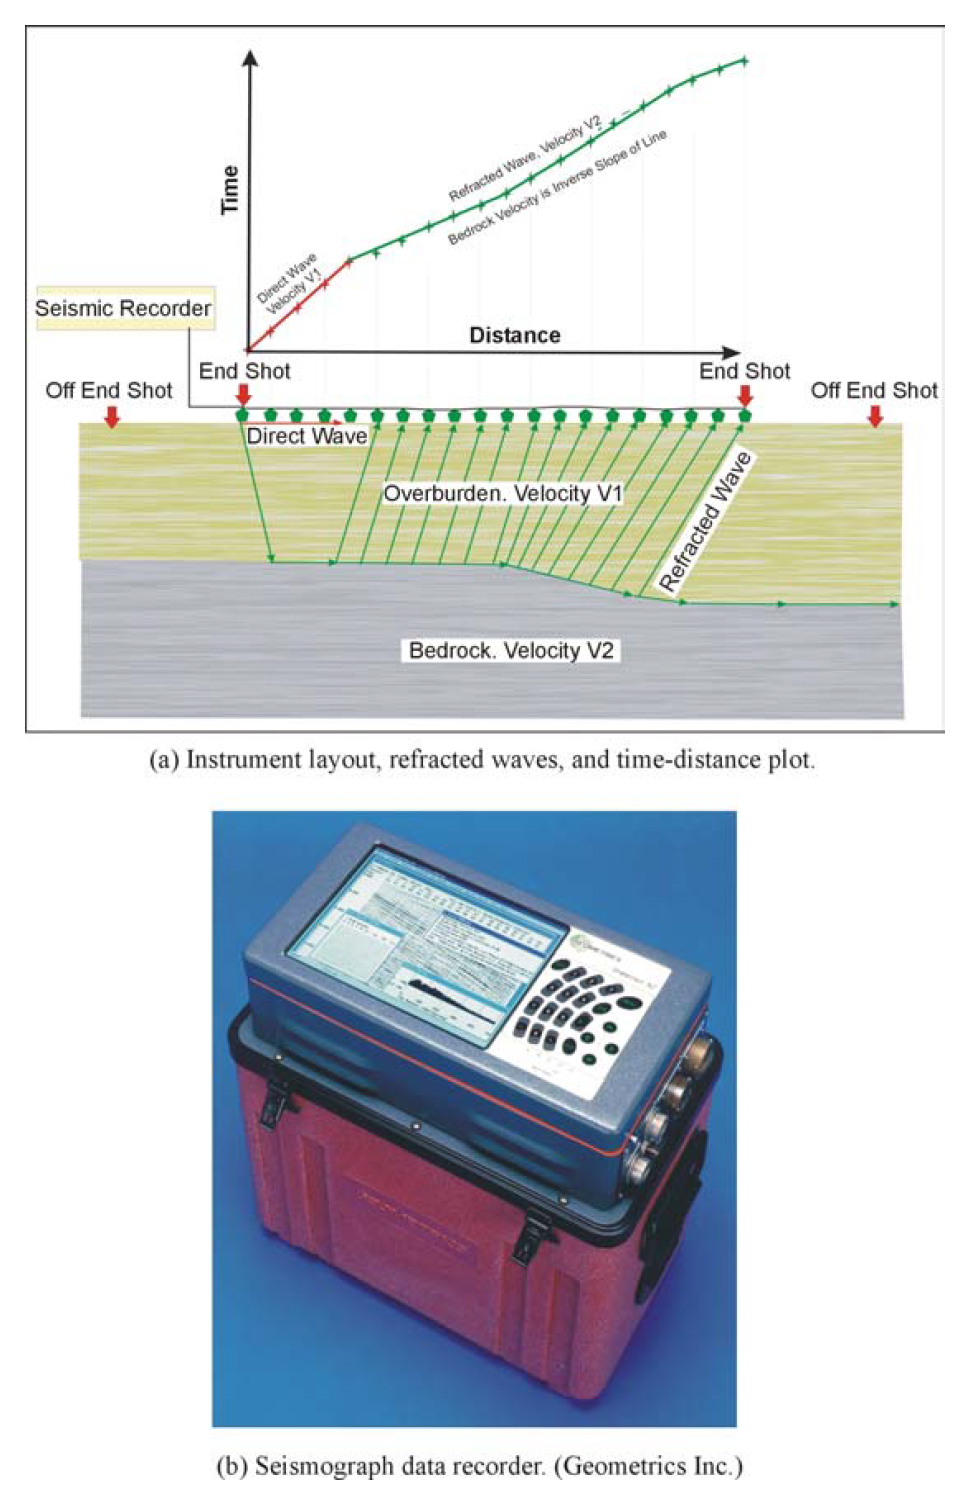
Figure 114. Seismic Refraction: field set up and data recorder.
Determining Porosity and Permeability
Porosity influences many physical properties of rocks, including seismic velocity and resistivity. However, these parameters are also influenced by many other factors, such as degree of saturation and the mechanical properties of the rock. Equations are presented describing the relationship between the compressional and shear wave velocities and porosity. However, other factors also influence the velocity of seismic waves in a rock, including the structure of the rock matrix, the connectivity of the pores, cementation, and past history. The resistivity of a rock is significantly influenced by the amount of water in the rock pores as well as the salinity of the water. However, clays also influence the resistivity. Thus, measurements of resistivity generally cannot be used to reliably estimate the porosity of soil or rocks. However, the relationship between resistivity and porosity, established by Archie in 1942, is presented since there may be instances where the factors other than porosity remain constant, and variations in porosity can be estimated.
Permeability is even more difficult to determine, since this is related to the degree of connectedness of the rock pores and has no direct physical property. However, a relatively new method called Nuclear Magnetic Resonance (NMR) is reported to be able, in the right conditions, to be able to determine the mean pore size and provide an estimate of the permeability.
Relationships between Seismic Velocities and Porosity
Relationships have been developed between the porosity of a rock and its seismic velocity, since porosity is an important factor in determining rock velocity. The equation presented below relates the transit time of a seismic wave to the porosity and transit times of the seismic wave in the pore fluid and rock matrix.
 (12)
(12)
where

where Δt is the specific transit time (slowness), Δtf and Δtm are the specific transit times of the pore fluid and rock matrix, and φ is the porosity.
This is an empirical equation and makes no allowance for the structure of the rock matrix and other factors that influence the velocity. In addition, this equation does not take into account pores occupied by other constituents other than water, e.g., clay. The equations presented below relate the velocity of the seismic waves to porosity and include a clay content term (C).
 (13)
(13)
 (14)
(14)
where
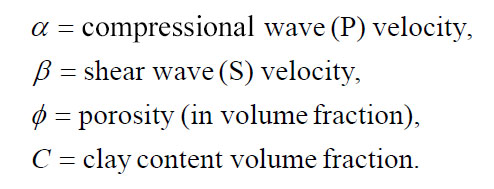
where α is the compressional wave velocity, β is the shear wave velocity, 𝝓 is the porosity (in volume fraction), and C is the clay content volume fraction.
Although these equations are used in well logging, especially for hydrocarbons, no literature was found showing their use for measuring porosity from surface geophysical methods.
Relationships between Resistivity and Porosity
The minerals comprising rock are almost always electrical insulators. Thus, electrical conduction occurs because of the moisture contained within the pores of the rock or soil. The resistivity of soil or rocks depends on several parameters including the clay content, moisture salinity, degree of saturation of the pores, and the number, size, and shape of the interconnecting pores. For soils, the degree of compaction (influencing porosity) is also an important factor. Archie (1942) developed an empirical formula relating resistivity to porosity, degree of saturation, and resistivity of the saturating moisture, shown below.
 (15)
(15)
where
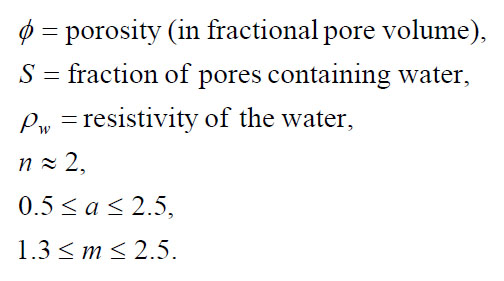
where 𝝓 is the fractional pore volume (porosity), S is the fraction of the pores containing water, ρw is the resistivity of the water, n is approximately 2, a and m are constants, with a varying between 0.5 and 2.5, and m varying between 1.3 and 2.5.
Under fairly restrictive conditions, this equation may be used to estimate porosity changes. It will be necessary to assume that the values of a and m remain constant for the area of interest. If the true resistivity of the formation or soil has been obtained, the pores are assumed to be saturated, and the resistivity of the pore fluid remains constant, variations in the measured resistivity can be attributed to variations in porosity. It seems likely that the variables a, m, s, n, and ρw will remain constant over limited areas.
Methods
Seismic Refraction
Basic Concept: The following description of the seismic refraction method applies to data recorded with either compressional or shear waves.
Seismic refraction can be used to find rock velocities, especially for depths less than 30 m. The method requires a seismic energy source, as discussed above, producing either compressional or shear waves. The seismic waves penetrate the overburden and refract along the bedrock surface. While they are traveling along this surface, they continually refract seismic waves back to the ground surface. If deeper refractors are present and are imaged by the refraction spread, they will also refract seismic waves back to the geophones on the ground surface. Figure 114a shows the layout of the instrument, the main seismic waves involved, and the resulting time-distance graph for a single layer, which is the bedrock surface.
Data Acquisition: The design of a seismic refraction survey requires a good understanding of the expected refractor layers and overburden. With this knowledge, velocities can be assigned to these features and a model developed that will show the parameters of the seismic spread best suited for a successful survey. These parameters include the length of the geophone spread, the spacing between the geophones, the expected first break arrival times at each of the geophones, and the best locations for the off-end shots. Knowing the expected first break arrival times is also helpful in the field, where field arrival times that correspond fairly well to expected times helps to confirm that the spread layout has been appropriately planned and that the target layer is being imaged.
Data Processing: The first step in processing/interpreting refraction seismic data is to pick the arrival times of the signal, called first break picking. A plot is then made showing the arrival times against distance between the shot and geophone. This is called a time-distance graph. An example of such a graph for a two-layered ground (overburden and refractor) is shown in figure 114a.
The red portion of the time-distance plot shows the waves arriving at the geophones directly from the shot. These waves arrive before the refracted waves. The green portion of the graph shows the waves that arrive ahead of the direct arrivals. These waves have traveled a sufficient distance along the higher speed refractor (bedrock) to overtake the direct wave arrivals. Rock velocities are obtained from the slope of the time-distance graph when the layers are horizontal. When this is not the case, other methods have to be used.
Data Interpretation: There are several methods of refraction interpretation. One of the most common methods is called the Generalized Reciprocal Method (GRM) that is described in detail in the Geophysical Methods section. A brief and simplified description of the GRM method is presented below. Figure 115 shows the basic rays used for this interpretation.
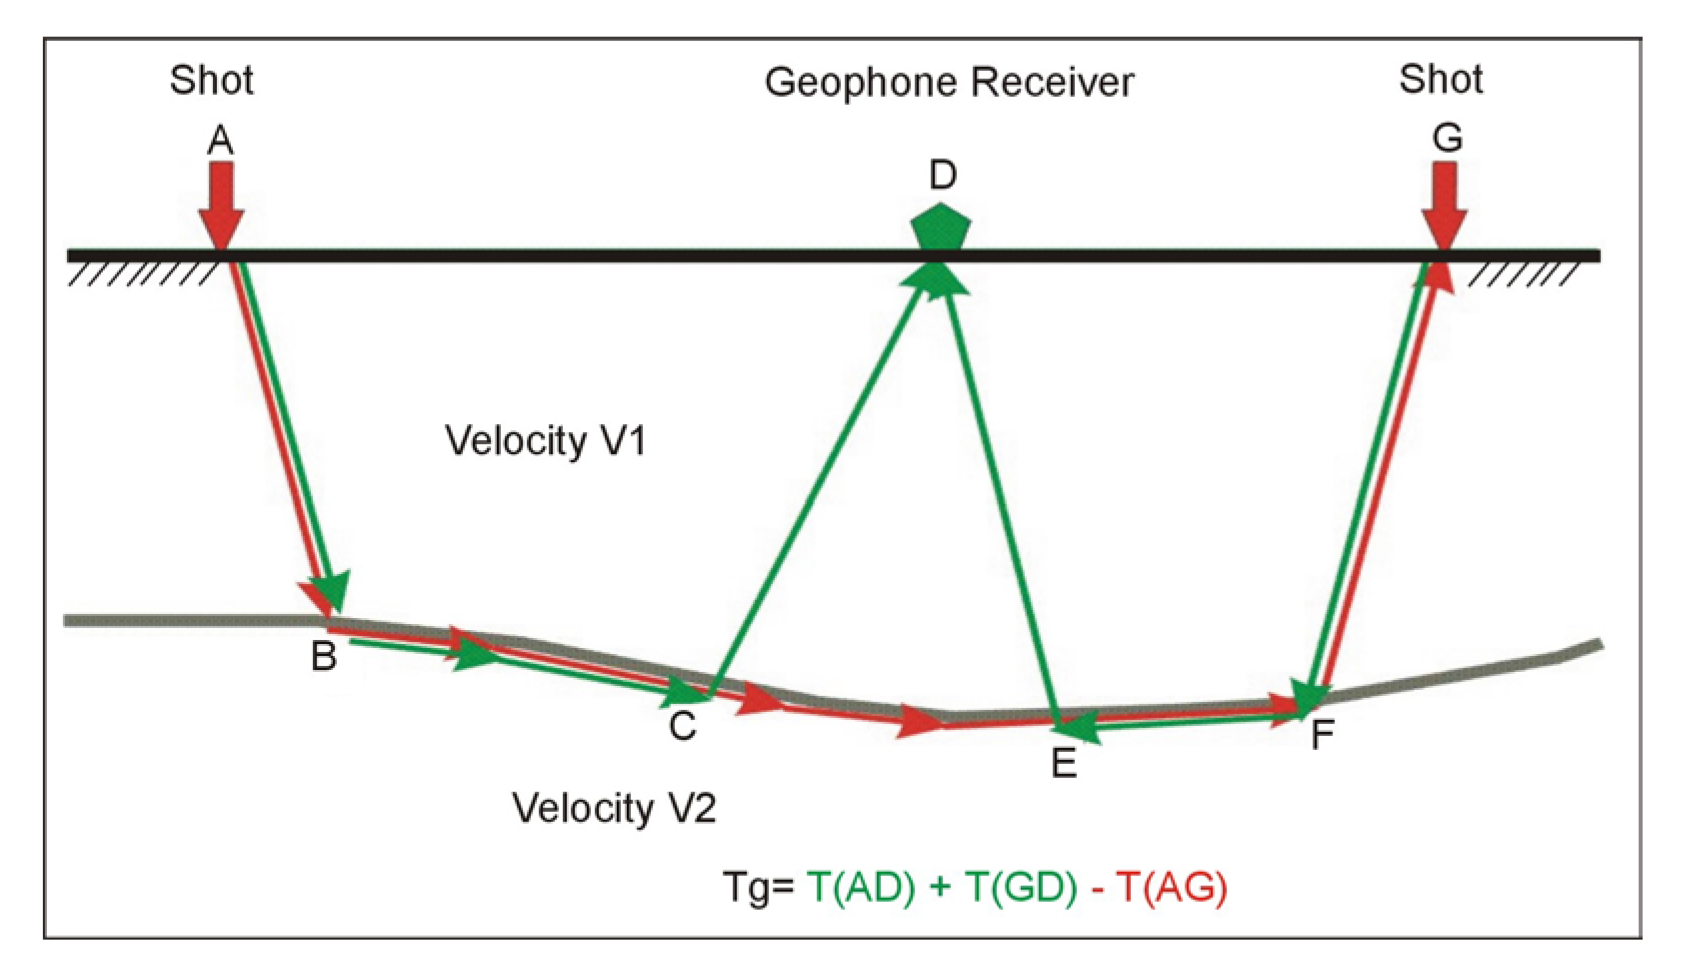
Figure 115: Basic Generalized Reciprocal method interpretation.
The depth to the bedrock under the geophone at D can be found using the following simple calculations. The travel times from the shots at A and G to the geophone at D are added together (T1). The travel time from the shot at A to the geophone at G is then subtracted from T1. Figure 116 shows the remaining waves after the above calculations have been performed. These are the travel times from C to D added to the travel times from E to D subtracting the travel time from C to E. The sum of these travel times can be shown to be approximately the travel time from the bedrock at H to the geophone at D. Since the velocity of the overburden layer can be found from the time-distance graph, the distance from H to D can be found giving the bedrock depth.
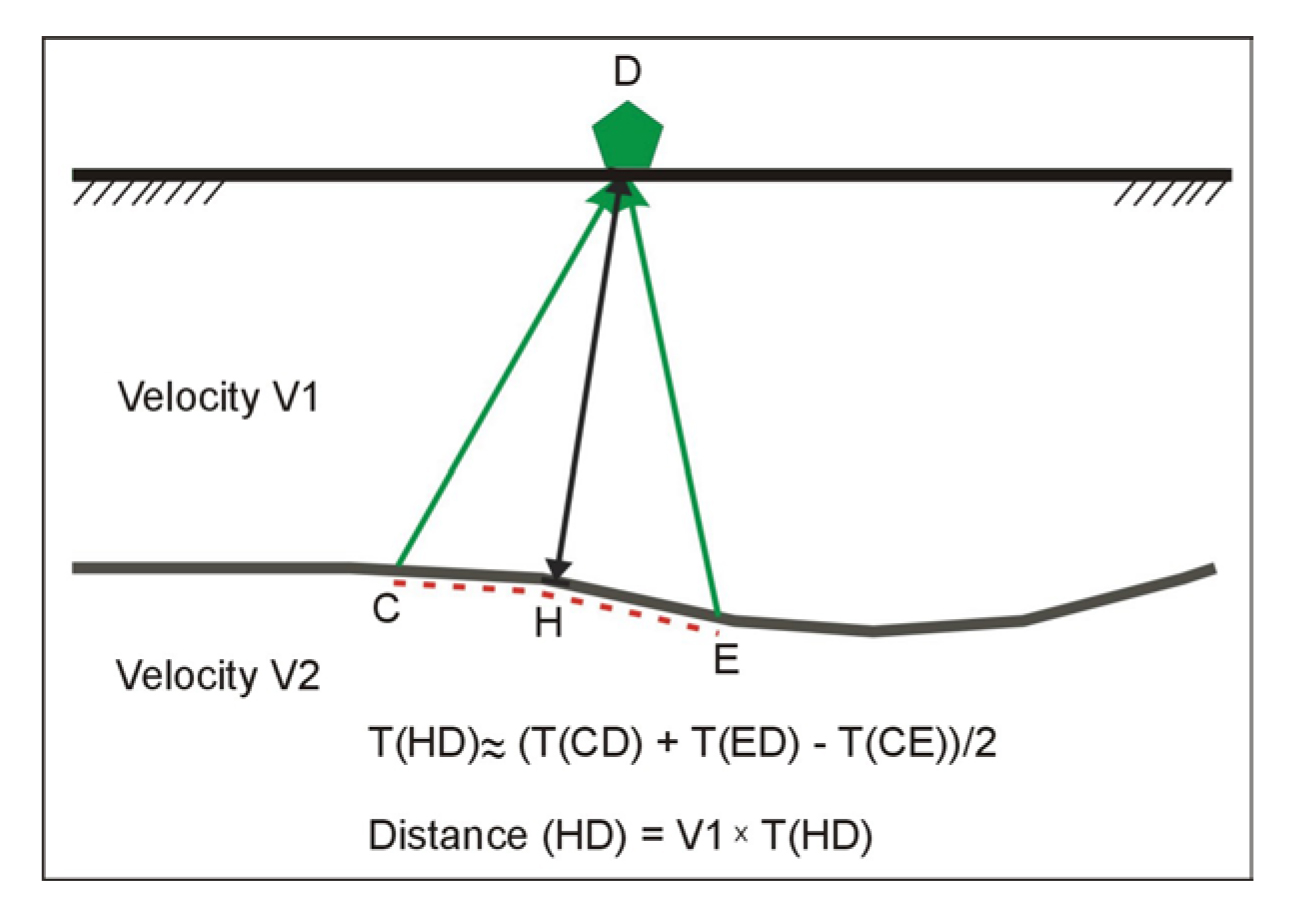
Figure 116. Generalized Reciprocal method intrepretation.
The velocity of the refracting layer is found by calculating the function T=(T(AD) - T(GD) + T(AB))/2 and plotting this function against distance. The inverse slope of this line is the velocity of the refractor. A more comprehensive interpretation is available with the full GRM method and is described in the section on Geophysics.
Once the compressional and shear wave velocities are obtained from a common layer, the elastic moduli can be calculated by substituting these velocities in the relevant equations given above. Thus, Poisson's Ratio, Young's Modulus, Bulk Modulus, Rock Density, and Shear Modulus can all be found.
Advantages: The seismic refraction method provides a reliable technique for determining the shear and compressional wave velocity in the bedrock.
Limitations: Probably the most restrictive limitation is that each successively deeper refractor must have a higher velocity than the shallower refractor. However, if only the bedrock velocity is required, then this should not be a serious limitation since the bedrock usually has a higher velocity than the overburden. If the weathered layer (overburden) velocity is laterally variable, a greater density of shots will be needed to measure this velocity. These data can then be used in the interpretation to provide more accurate bedrock depths.
If the water table is in the overburden and close to the bedrock, this may obscure the bedrock arrivals since saturated soils have a higher velocity than unsaturated soils.
Local noise, for example traffic, may obscure the refractions from the bedrock. This can be overcome by using larger impact sources or by repeating the impact at a common shot point several times and stacking the received signals. If noise is still a problem, a larger energy source may be required. In addition, since some of the noise travels as airwaves, covering the geophones with sound absorbing material may also help to dampen the received noise.
Nuclear Magnetic Resonance
Basic Concept: The Nuclear Magnetic Resonance (NMR) method is also known as the Proton Magnetic Resonance (PMR) method. In this web manual, the term "NMR" will be used. This method is still being developed, although commercial equipment for taking NMR measurements is currently available. The NMR method is based on the excitation of protons in the subsurface water in the presence of the Earth's magnetic field. Because the method is essentially experimental, only a brief discussion is presented below.
The instrument consists of a transmitter and receiver. The transmitter drives alternating current at the proton resonance frequency through a loop of wire laid on the ground. The current is abruptly terminated, and the NMR signal is measured using the transmitter wire loop as a receiving antenna. This procedure is repeated several tens to a few hundreds of times, during which the NMR signal is recorded and averaged to improve the signal-to-noise ratio. The signal is interpreted in terms of hydrological parameters as a function of depth. Figure 164 shows the basic physics of the NMR method.
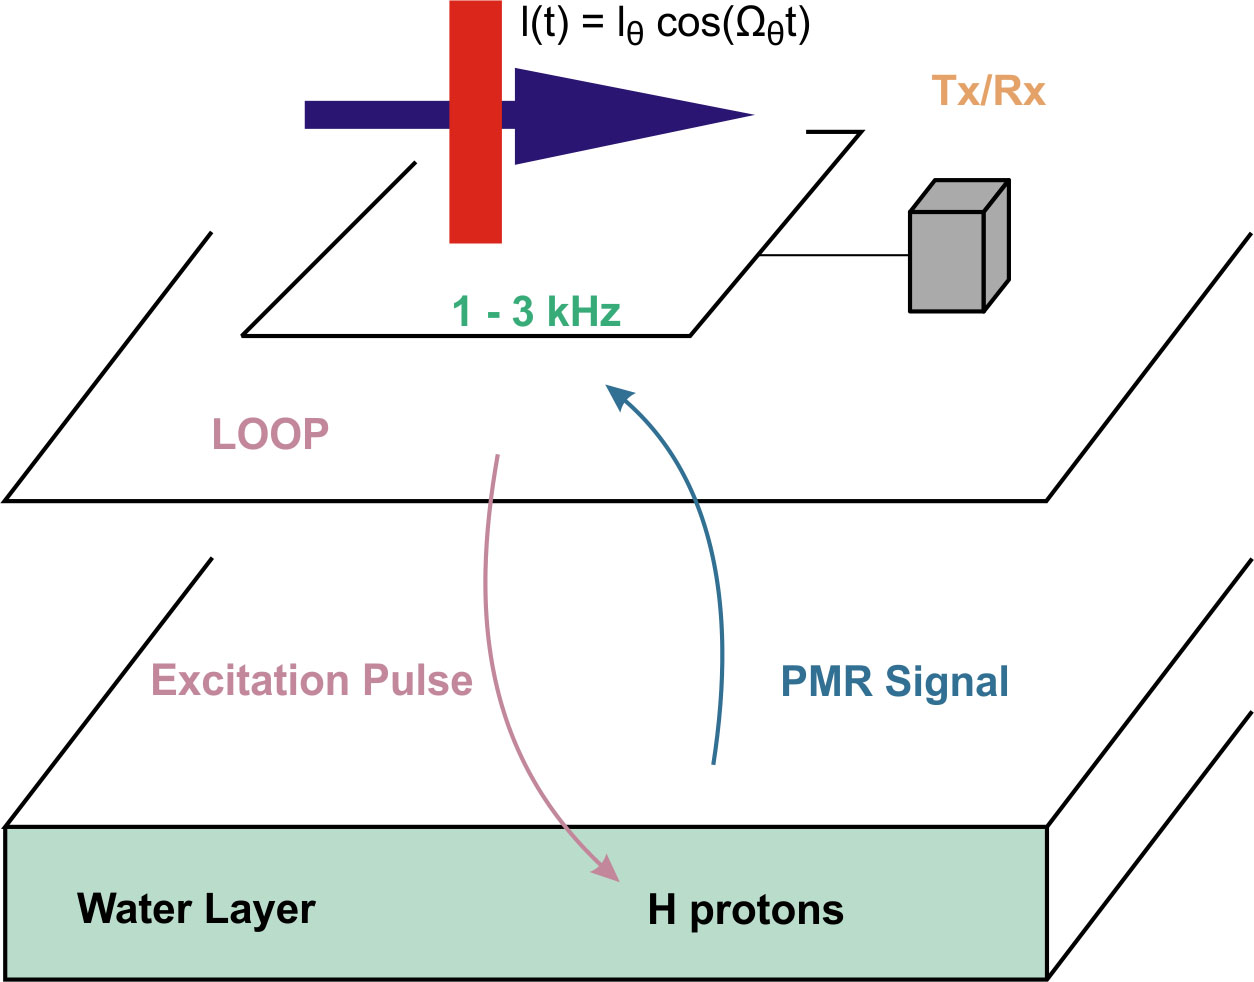
Figure 164. Schematic of the Nuclear Magnetic Resonance method. (IRIS Instruments)
The transmitter/receiver loop provides the electromagnetic pulses that excite the protons in groundwater. These protons decay during the transmitter current off time, and the field from this decay is detected by the same loop of wire now acting as a receiver. The data are stored in the control transmitter/receiver (Tx/Rx) box. Figure 165 shows the instruments for measuring NMR.

Figure 165. Instrument for measuring Nuclear Magnetic Resonance. (IRIS Instruments)
Data Acquisition: NMR surveys are conducted by laying a loop of wire on the ground. The size of the loop depends on the Pulse Moment (current multiplied by time while current is transmitted) during the measurement, which determines the depth of investigation. A typical loop size for investigation depths to 100 m might be 100 m side length. Rectangular pulses of alternating current are passed through the wire with a frequency equal to that of the proton resonance in the Earth's magnetic field, as illustrated in figure 164. Signals are received by the wire loop while the current is off.
Six basic steps define the general procedure for carrying out NMR soundings:
- Measure the strength of the Earth's magnetic field. From this, the frequency of the signal to transmit can be found.
- Transmit a pulse of current using the wire loop at the frequency found in step1.
- Measure the amplitude of the water NMR signal.
- Measure the time constant of the signal.
- Change the pulse intensity to modify the depth of investigation.
- Interpret the data using an inversion program to get porosity versus depth.
Data Interpretation: Figure 166 shows the field data from an NMR sounding along with the interpretation. The field data curve (left plot) shows the noise level (blue circles), the measured field data (black squares), and the interpretation fit (red line). The right-hand graph shows the interpretation, presenting a plot of porosity versus depth. Since the method detects water, in order to obtain porosity, it is assumed that the layers are saturated. The method is also reported to be able to provide mean pore size along with permeability estimates.
F
Figure 166. Field data and interpratation of a Nuclear Magnetic Resonance survey, (IRIS Instruments)
There are four important facts concerning the interpretation of the results.
- The method detects water. No signal is observed if no water is present.
- The amplitude of the NMR signal is related to the variation in water content with depth.
- The decay time constant of the NMR signal is related to the variation in mean pore size against depth.
- The phase shift between the NMR signal and the current is related to the layer resistivity variation with depth.
Advantages: The main advantage of the NMR method is that it responds only to the protons within water.
Limitations: The method requires large currents to be used when transmitting, necessitating large-diameter wire. Therefore, the wire is heavy and can be difficult to lay out in any area with bush or significant topography. Probably the biggest limitation is the influence of electrical noise, such as power line noise. Generally, soundings need to be at least 1,000 m from any power line.
If magnetic minerals are present in the subsurface, these destroy the uniform magnetic field required, normally the Earth's field, to initialize the proton oscillations in the groundwater. When these magnetic minerals are present, the NMR method is ineffective.
Ground Penetrating Radar
Basic Concept: Ground Penetrating Radar (GPR) is used to measure the moisture content of soils. Water has a dielectric constant of about 80, whereas air is 1. Dry sand has a value varying between 3 and 5, and saturated sand has a value between 20 and 30. Therefore, since the GPR signals respond to variations in the dielectric constant, water content is one of the most important factors. This, along with the velocity of the GPR signals in the soil, can be used to estimate soil moisture content.
Ground Penetrating Radar (GPR) can be used providing the conditions are appropriate for the method. Clay in the soil will attenuate the GPR signal and severely limit depth penetration. The GPR signal is severely attenuated if the ground is electrically conductive. Ideal conditions are dry, sandy soils, although good results should be obtained in soils saturated with fresh (resistive) water. In ideal conditions, the method may penetrate to depths of 15 m.
The GPR instrument consists of a recorder and a transmitting and receiving antenna. Different antennae provide different frequencies. Lower frequencies provide greater depth penetration, but lower resolution. Figure 111 provides a drawing illustrating the GPR system. The transmitter provides the electromagnetic signals that penetrate the ground and are reflected from objects and boundaries that have a different dielectric constant from that of the overburden. The reflected waves are detected by the receiver and stored in memory.
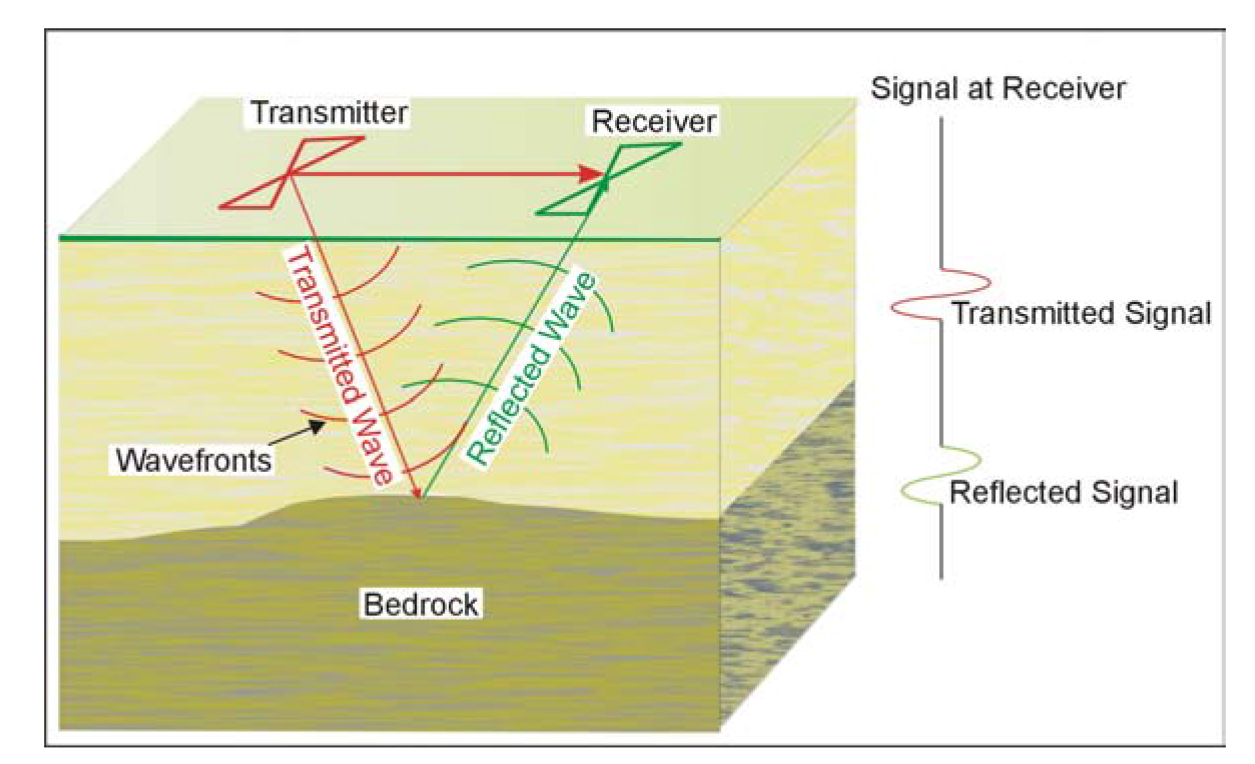
Figure 111. Ground Penetrating Radar system.
Several companies manufacture GPR equipment. These include Geophysical Survey Systems Inc (GSSI), GeoRadar, Mala GeoScience, and Sensors and Software.
Figure 112 shows the data recording and system control for a GPR instrument. Any antenna supported by this instrument can be attached and used to collect data. Figure 113 shows a 100 MHz antenna that can be used with the above instrument. The 100 MHz antenna is suited for deeper applications to depths of 15 to 20 m. Different antennas are available each with a different frequency. Higher frequencies provide better resolution, but less depth penetration. The choice of antenna is important in GPR surveys. However, the most important parameter is to provide sufficient penetration depth.
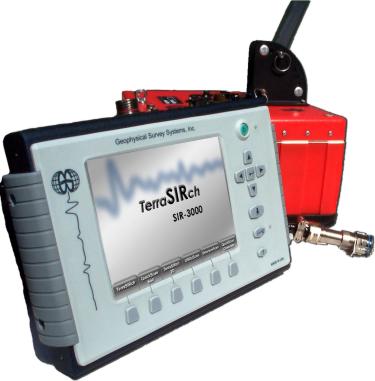
Figure 112. Ground Penetrating Radar instrument. (Geophysical Survey Systems, Inc.)
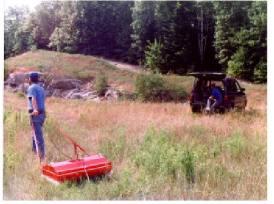
Figure 113. Ground Penetrating Radar antenna (100 MHz) used in a survey. (MALA GeoScience USA, Inc.)
Data Acquisition: GPR surveys are conducted by pulling the antenna across the ground surface at a normal walking pace. The recorder stores the data, as well as presenting a picture of the recorded data on a screen.
Data Processing: It is possible to process the data, much like the processing done on single-channel reflection seismic data. Processing might include distance normalization, horizontal scaling (stacking), vertical and horizontal filtering, velocity corrections- and migration.
Data Interpretation: Changes in the electrical properties of the soil are usually related to changes in the soil moisture content. Soil moisture content can be derived from the velocity of electromagnetic waves in the soil using a conversion from velocity to dielectric constant. The prediction of soil moisture content is still being researched.
Advantages: The GPR method is easy to use in the field and the data is presented on a screen as is being recorded. This allows changes in the data recording parameters to be made during the survey. Thus, if the depth of penetration is insufficient then a lower frequency antenna can be tested.
Limitations: In determining the moisture content of soils, probably the most limiting factor is the amount of clay that the soil contains, since this will attenuate the GPR signal and limit penetration. In addition, determining soil moisture content requires fairly uniform soils. If the soil is not homogeneous, other factors may influence velocity changes and give false moisture content values.
Spectral Analysis of Surface Waves
Basic Concept: The velocity of shear waves can be obtained from the Spectral Analysis of Surface Waves (SASW) method. This method has an advantage over the seismic refraction method in that data can be recorded in areas where the velocity of deeper material is less than the overlaying material, called a velocity inversion. In addition, the method gives bulk estimates of the subsurface velocities, which may sometimes be more appropriate than the more defined values given by the seismic refraction method.
This method is based on the propagation of mechanically induced Rayleigh waves. By striking the ground surface with a light hammer, a transient stress wave is created, including surface or Rayleigh waves, which are registered by two transducers placed in line with the impact point on the ground surface at fixed separations. The transducers, which may be small accelerometers, register the passage of the waves. The receiver outputs are plots of the phase difference between the two transducers as a function of frequency. A profile of Rayleigh wave velocity versus wavelength, or so-called dispersion curve, is calculated from the phase plot. The ratio of Rayleigh wave velocity to shear wave velocity is approximately 0.9:1; thus, the shear wave velocity can be estimated. The shear stiffness (G) of the ground can be calculated from the shear velocity if the material density is known. Thus, we obtain a plot of ground stiffness as a function of depth from the surface.
Rayleigh waves have velocities that depend on their wavelength, a phenomenon called dispersion. Waves having different wavelengths sample to different depths, with the longer wavelengths sampling to greater depths. Figure 35 illustrates the sampling depths and particle motion of two Rayleigh waves having different wavelengths.

Figure 35. Schematic showing variation of Rayleigh wave particle motion with depth.
This principle is used to measure the thickness of ground layers with different stiffness properties. It can also be used to locate and roughly delineate inhomogeneities such as voids.
The major advantages of the SASW method are that it is non-invasive and non-destructive, and that a larger volume of the subsurface can be sampled than in borehole methods.
Data Acquisition: The surface wave dispersion curve can be measured using an active source and a linear array of receivers. The dispersion curve is then inverted to determine the corresponding shear wave velocity profile.
There are two main methods used in surface wave exploration. The most common surface wave method in industry is called SASW testing. The other method, which uses an array of geophones, is generally called array methods. The field setup is shown in figure 36. Either a transient or continuous point source is used to generate Rayleigh waves, which are monitored by in-line receivers. The data acquisition system calculates the phase difference between the receiver signals. These phase data are processed later into the dispersion curve, which is modeled analytically to determine a compatible shear wave velocity profile for the site. The data acquisition system is discussed in more detail below.

Figure 36. Basic configuration of Spectral Analysis of Surface Waves measurements.
The source used depends on the desired profiling depth. Heavier sources generating lower frequency waves provide deeper interpretations. A combination of sources is commonly used to measure dispersion over a broad enough bandwidth to resolve both the near-surface and greater depth. Transient sources include sledgehammers (<15 m depth) and dropped weights. Continuous sources include the electromagnetic vibrator (<40 m depth), eccentric mass oscillator, heavy equipment such as a bulldozer (30 to 150 m depth), and the vibroseis truck (<120 m depth). A pair of vertical receivers monitors the seismic waves at the ground surface. For profile depths of around 100 m, 1-Hz geophones are required. Five or 10-Hz geophones can be used for surveys from 10 to 30 m depth. Theoretical as well as practical considerations, such as attenuation, necessitate the use of an expanding receiver spread. Data are recorded using sources on both sides of the geophones, called the forward and reverse directions (figure 36).
Data Processing: In the SASW method, a Fast Fourier Transform (FFT) analyzer or PC-based equivalent is used to calculate the phase data from the input time-voltage signals. Typically, only the cross power spectrum and coherence are recorded. Coherent signal averaging is used to improve the signal-to-noise ratio, a process similar to stacking of seismic records.
Because of the initial processing done by the analyzer in the field, the effectiveness of the survey can be assessed and modified if necessary. An initial estimate of the shear wave velocity (VS) profile can be made quickly.
Data Interpretation: Interpretation consists of modeling the surface wave dispersion to determine a layered VS profile that is compatible. The acquisition and processing techniques of SASW methods do not separate motions from body wave, fundamental mode Rayleigh waves, and higher modes of Rayleigh waves. Usually it is assumed that fundamental mode Rayleigh wave energy is dominant, and forward modeling is used to build a 1-D shear wave velocity (VS) profile whose fundamental mode dispersion curve is a good fit to the data.
Advantages: The major advantages of the SASW method are that it is non-invasive and non-destructive, and that a larger volume of the subsurface can be sampled than in borehole methods.
Limitations: The depth of penetration and resolution of surface wave methods have not been thoroughly studied. This is due, in part, to the widespread use of forward modeling rather than formal inversion. The depth of penetration and resolution are also heavily site and profile dependent.
The depth of penetration is determined by the longest wavelengths in the data. In modeling, there is a trade-off between resolution (layer thickness) and variance (change in VS between layers). Data that are noisier must be smoothed and will have less resolution because of this. Whether a particular layer can be resolved depends on its depth and velocity contrast. The modeled VS profile is insensitive to reasonable variations in density. The compressional wave velocity (VP) cannot be resolved from dispersion data, but has an effect on modeled VS. The difference in VP in saturated versus unsaturated sediments causes differences of 10% to 20% in surface wave phase velocities, which lead to differences in modeled VS.
The depth of penetration is determined by the longest wavelengths that can be generated by the source, measured accurately in the field, and resolved in the modeling. Generally, heavier sources generate longer wavelengths, but site conditions are often the limiting factor. Attenuation characteristics of the ground determine the signal level at the geophones. Cultural noise (traffic, rotating machinery) at a site may limit the signal-to-noise ratio at low frequencies. In SASW methods, the depth of resolution is usually one-half to one-third of the longest wavelength.
The field setup requires a distance between the source and most distant geophone of two to three times the resolution depth. However, forward modeling allows for subjective interpretation of the sensitivity of the dispersion curve to the layered VS model. Resolution decreases with depth. A rule of thumb is that if a layer is to be resolved, the layer thickness (resolution) should be at least around one-fifth of the layer depth.
Data recording and processing are more difficult than with the seismic refraction method.