Estimating Clay Content
Clays are very small-grained hydrous aluminosilicates with the phyllosilicate structure. Clays are classified as hydrosilicates, which means that they are formed from the chemical decomposition of pre-existing silicate minerals. Most clays result from the product of weathering and sedimentation, but they are also formed by hydrothermal activities. Clays can occur as part of a soil structure or as independent layers and lenses. They are also commonly found in glacial till, where glacial action has ground the rocks and boulders into fine particles.
Clay particle sizes range from 0.002 mm to 0.001 mm diameter for quartz, feldspar, mica, iron, and aluminum oxides. The finer parts (less than 0.001 mm in diameter) are colloidal and consist mainly of layer silicates with smaller amounts of iron and aluminum oxides. These consist of microscopically fine particles exhibiting a sheet-like structure. Their crystalline structure is such that, because of crystal imperfections, the surface appears negatively ged. During the formation of clay through weathering, positive ges (cations) are adsorbed to the surface. These cations are loosely held to the surface and can subsequently be exchanged for other cations or essentially go into solution if the clay is mixed with water. For this reason, they are called exchangeable ions, and the cation exchange capacity (CEC) of the soil is a measure of the number of cations that are required to neutralize the clay particle as a whole.
Any fine-grained mineral, including quartz, has a cation exchange capacity. However, clay particles are very small, and because the surface area per unit volume is very large, a large number of cations are adsorbed. These adsorbed cations can contribute significantly to the electrical conductivity of soil, which then becomes a function of the clay content. However, other factors influence the conductivity of soil, including the degree of saturation and the salinity of the pore fluid.
Because of their electrical structure, clay minerals often exhibit an effect called membrane polarization. This is a distribution of ions around the clay pores. When a DC potential is applied across the pore, negative ions accumulate at one end and leave the other end. Because of this polarization distribution, current flow is impeded. When the DC potential is switched off, the ions take a finite amount of time to return to their original positions.
From the above discussion, two basic parameters can be used to estimate the clay content of soils and other geologic layers. These are electrical conductivity and membrane polarization. Thus, the appropriate geophysical methods are conductivity measurements (or resistivity) and Induced Polarization to measure the membrane polarization.
The resistivities of soils and rocks vary from 1 to 30 ohm-m for some clays and shales to over 1,000 ohm-m for limestone, intrusive rocks such as granites, and some metamorphic rocks. However, in sedimentary soils and rocks, where resistivities generally range from 10 to 1,000 ohm-m, resistivity is also significantly influenced by the porosity and salinity of the water in the pore space.
In order to estimate clay content, the resistivity/conductivity of the layer/zone of interest has first to be determined. Then a relationship is needed to convert the conductivity to clay content. However, as mentioned previously, conductivity is strongly influenced by porosity and the salinity of the pore water, thus making the conversion from conductivity to clay content tenuous.
It is possible that the Induced Polarization method may be more successful since it is less influenced by the resistivity of the material. However, the method needs more research before production surveys are undertaken.
Methods
Conductivity Measurements
Basic Concept: Ground conductivity measurements are recorded using several instruments that use electromagnetic methods. The choice of which instrument to use generally depends on the depth of investigation desired. Instruments commonly used include the EM38, EM31, EM34, and the GEM2.
The EM38 is designed to measure soil conductivities and has a maximum depth of investigation of about 1.5 m. The EM31 has a depth of investigation to about 6 m, and the EM34 has a maximum depth of investigation to about 60 m. The depth of investigation of the GEM2 is advertised to be 30 to 50 m in resistive terrain (>1,000 ohm-m) and 20 to 30 m in conductive terrain (<100 ohm-m).
Electromagnetic instruments that measure ground conductivity use two coplanar coils, one for the transmitter and the other for the receiver. These instruments transmit sinusoidal electromagnetic fields oscillating between 330 Hz and 25 kHz (GEM2).
With the EM31 and EM34, the transmitter coil produces an electromagnetic field, oscillating at less than 10 kHz, that produces secondary currents in conductive material in the ground. The amplitude of these secondary currents depends on the conductivity of the material. These secondary currents then produce a secondary electromagnetic field that is recorded by the receiver coil.
These instruments can be used with the planes of the coils held parallel to the ground (vertical dipole mode) or perpendicular to the ground (horizontal dipole mode). The investigation depth is greatest in the vertical dipole mode and least in the horizontal dipole mode. In addition, in the vertical dipole mode, the conductivity readings are insensitive to near-surface conductivity changes, whereas in the horizontal dipole mode, the readings are significantly influenced by near-surface conductivity changes.
The EM38 instrument is shown in figure 103. This instrument is used for shallow surveys, usually measuring the conductivity of soil and has had a significant amount of use in agricultural areas, mapping areas of high salinity.
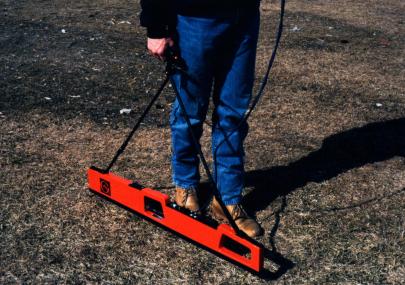
Figure 103. EM38 instrument being used in vertical dipole mode. (Geonics, Ltd.).
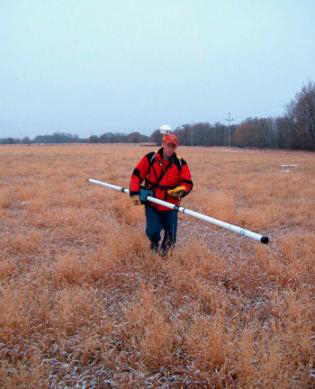
Figure 183. EM31 instrument being used in vertical dipole mode. (Geonics, Ltd.)
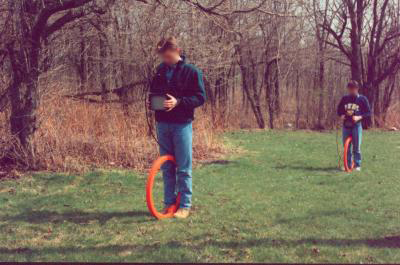
Figure 197. The EM34 being used in horizontal dipole mode. (Geonics, Ltd.)
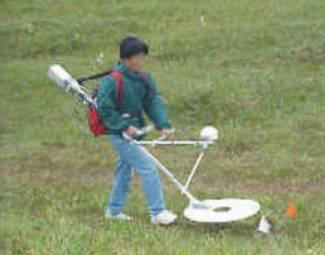
Figure 219. The GEM-3 electromagnetic instrument. (Geoplex, Inc.)
Data measurements with the EM34 can be made using three different separations of the two coils, for each of the two modes, providing six different depths of investigation. However, as the depth of investigation increases, the lateral resolution decreases. The EM34 requires two people to operate. Data recording is also much slower than with the EM31. All of these instruments measure the bulk electrical conductivity of the ground. Since the conductivity of several different layers may be included in the measured conductivity, the correct technical term for the measured conductivity is apparent conductivity. When discussing data from these instruments in this web manual, conductivity is understood to mean apparent conductivity.
Data Acquisition: Surveys are conducted by taking readings along lines crossing the area of interest. These lines need to be surveyed to have spatial coordinates recorded. Readings are either taken at defined stations or on a timed basis, say every second (EM31). The mode in which the instruments are used (EM31 and EM34) depends on the target depth and the objectives. The instruments store the data in memory as they are recorded, allowing it to be downloaded to a computer later.
Data Processing: Data processing mostly involves assigning coordinates to each data point. These data are then gridded, contoured, and plotted, producing a map of the measured conductivity of the site.
Data Interpretation: Interpretation is done from this map. Generally, this will involve searching for areas of high electrical conductivity. These areas will be the most likely places to find clay.
A general relationship between clay content and conductivity when using the EM38 has been established during a survey in Denmark and is shown in figure 104. These data are for the EM38 used in the vertical dipole mode and is for shallow soils (less than 2 m). As can be seen, when the clay content increases, the soil conductivity also increases. The graph shows that when the conductivity is 10 mS/m, the clay content is 15%. When the soil conductivity is 15 mS/m, then the clay content is 20%.
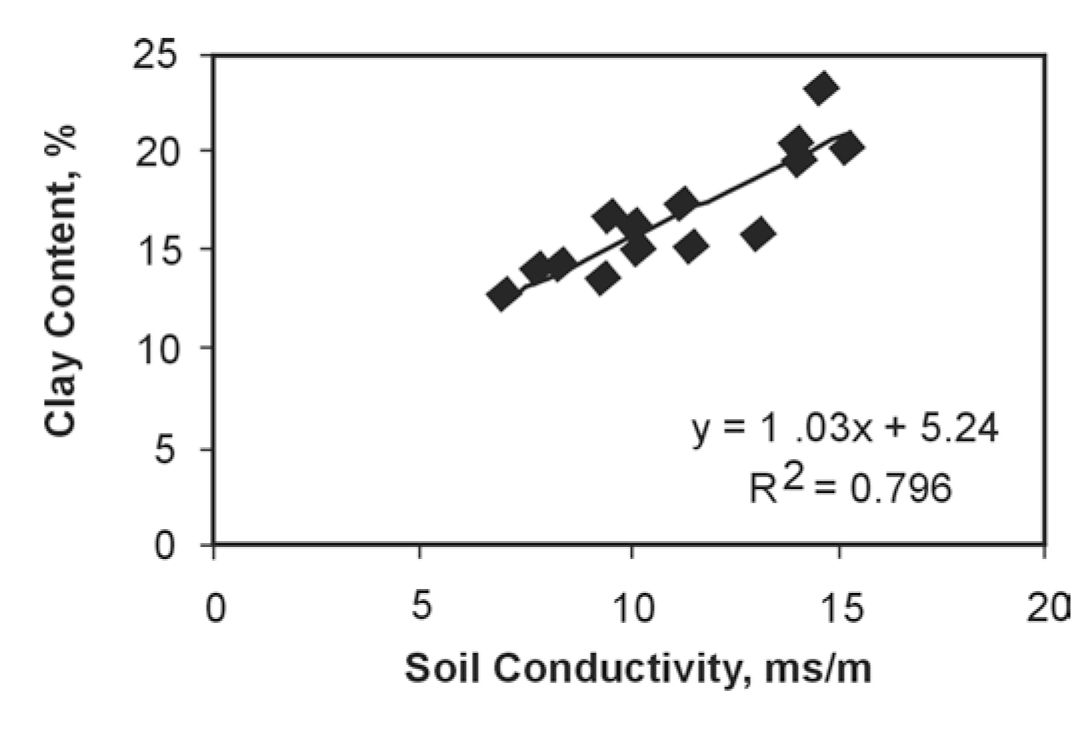
Figure 104. Relation between soil conductivity and clay content. (Dalgaard, et al.)
It is likely that this relationship is site specific, and a new relation will likely be required for each site surveyed. However, the data show that, at least in this case, a relationship was established between soil conductivity and clay content.
To establish this relationship with the EM31, where the depth of investigation may be up to about 6 m, the soil/overburden layer must have a depth greater than 6 m. If this is not the case, and the conductivity values are being influenced by bedrock, the measured conductivity will be a composite of the soil and bedrock conductivities. Therefore, the relationship shown in figure 104 probably cannot be established. In this case, areas of high conductivity may correspond to increased clay in the soil, an increase in the conductivity of the bedrock, or, if the conductivity of the soil or overburden is greater than that of the bedrock, possibly an increase in the thickness of the soil/overburden layer. In this case, areas of high conductivity will need to be investigated by other methods to establish the clay content.
If the EM34 is used in the horizontal dipole mode, the soil conductivity will influence the measured conductivity readings, depending on the thickness of the soil layer, since in this mode, the readings are sensitive to near-surface conductivity changes. If the vertical dipole mode is used, the influence of the soil conductivity on the measured conductivity values will probably be minimal. The interpretation of these data depends on the geology of the area. If geological layering exists, the conductivity changes may indicate overburden or layer thickness changes or lateral conductivity changes in one of the layers. Additional information about the layer thicknesses is needed to produce a more definitive interpretation. Seismic refraction or resistivity measurements may be able to provide this additional information.
Advantages: Conductivity data can be recorded with either then EM31 or EM34 fairly efficiently. The depth of investigation can be chosen by using the different modes of data acquisition along with maximizing the depth of investigation (Vertical dipole mode) or the influence of near surface material (horizontal dipole mode).
Limitations: Clay is almost always electrically conductive, and areas of high conductivity have a reasonable chance that they will contain clay. However, estimating the amount of clay from conductivity measurements alone is generally not possible. This is because conductivity is influenced by many factors including the degree of saturation, porosity, and salinity of the pore fluids. In addition, the conductivity measurements taken with instruments that investigate to depths greater than the upper layer are also influenced by other layers. These layers can change in thickness and conductivity, making a definitive interpretation of the conductivity of any one of these layers difficult without additional information such as laboratory clay content analysis or soil boring results.
Conductivity measurements taken using electromagnetic instruments will be influenced by local above or below ground metal.
Resistivity Measurements
Basic Concept: Resistivity measurements, which are the inverse of conductivity measurements, can also be used to locate the occurrence of clay and possibly estimate the clay content.
Resistivity methods can be divided into three groups. The first two are resistivity soundings and traverses. The last group combines both resistivity sounding and traverse data to form a resistivity section. Since the data recording of conductivity along a traverse using the EM38/31/34 are much more efficient than resistivity measurements along a traverse, resistivity traverses are now rarely used. Resistivity soundings may be useful but only provide information on the vertical distribution of resistivity at the sounding location. It is, therefore, unlikely that resistivity soundings will be the primary tool for locating clay or attempting to obtain clay content, since lateral variations in resistivity are also important.
Since lateral resistivity measurements are efficiently taken using instruments that measure conductivity (the inverse of resistivity), resistivity traverses will not be discussed. Resistivity soundings may be appropriate in some cases and are discussed briefly. However, using one of the more recently developed resistivity systems, data can be efficiently recorded that combines both traverse and sounding results. These newer instruments use electrodes that are addressable by a central control system, and the term "automated resistivity" system is sometimes used to describe them.
Resistivity measurements are taken by passing electrical current into the ground using two electrodes and measuring the resulting voltage using two other electrodes. A number of different electrode arrays are used, some of which are shown in figure 90. The depth of investigation is determined by the electrode separation, with larger separations providing greater depths. The measured resistivity is calculated by dividing the measured voltage by the current and multiplying this by a geometric factor that accounts for the particular electrode array used.
These arrays are used for different types of resistivity surveys. The Schlumberger array is often used for resistivity soundings, as is the Wenner array. The Pole-pole array provides the best signal, but is cumbersome because of the long wires required for the remote electrodes, and it is rarely used. The Dipole-dipole array was originally used mostly by the mining industry for induced polarization surveys. Readings were taken using several different separations of the voltage and current dipoles providing measurements of the variation of resistivity with depth. Long lines of data were recorded requiring many readings. This array has now become common for resistivity surveys using the automated resistivity systems. If more signal (voltage) is needed than can be provided with the dipole Dipole-array, then the Pole-dipole array can be used.
Automated Resistivity Systems
Automated resistivity systems make recording resistivity data much more efficient, and by taking many measurements at different electrode spacings along a traverse, are able to build a comprehensive picture of the subsurface. Figure 201 shows one such system called the Sting/Swift automated resistivity measuring system.
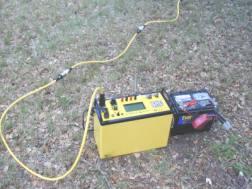
Figure 201. SuperSting R1 IP resistivity meter. (Advanced Geoscience, Inc.)
Figure 105 shows a similar system called a Syscal Junior 72 system, which can access 72 electrodes.
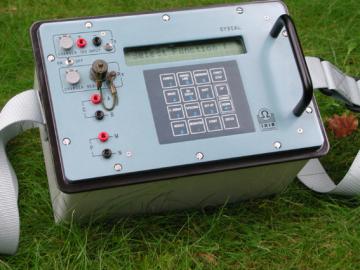
Figure 105. Syscal Junior automated resistivity system. (IRIS Instruments).
Data Processing: Usually little processing is done to the resistivity data obtained with this system. The data are plotted to form a "pseudosection" as shown in figure 152. Data from the smaller electrode spacings are plotted closer to the line representing the ground surface, and data from the larger electrode spacings are plotted more distant, vertically, from the top of the plot, thus simulating a plot of resistivity against depth along the traverse.
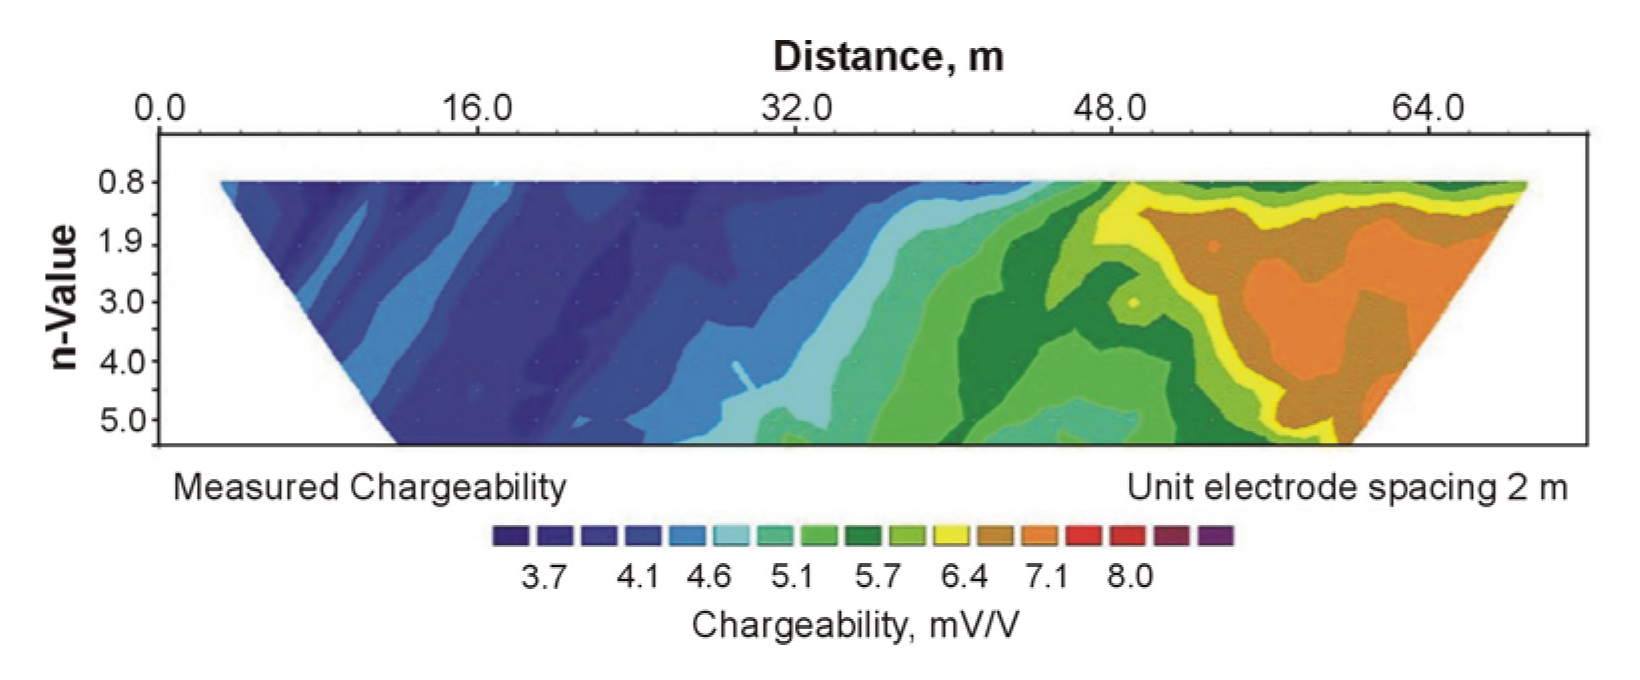
Figure 152. Chargeability pseudosection. (Terraplus, Inc.)
Data Interpretation: Data from the automated resistivity system are interpreted by software that calculates a pseudosection from a model and then alters the model until the calculated pseudosection matches that of the field data, a process called inversion. However, much information can be gained visually.
An example of the results from such a survey is presented in figure 149. The data have been inverted showing the resistivity variation, both laterally and vertically, against depth.
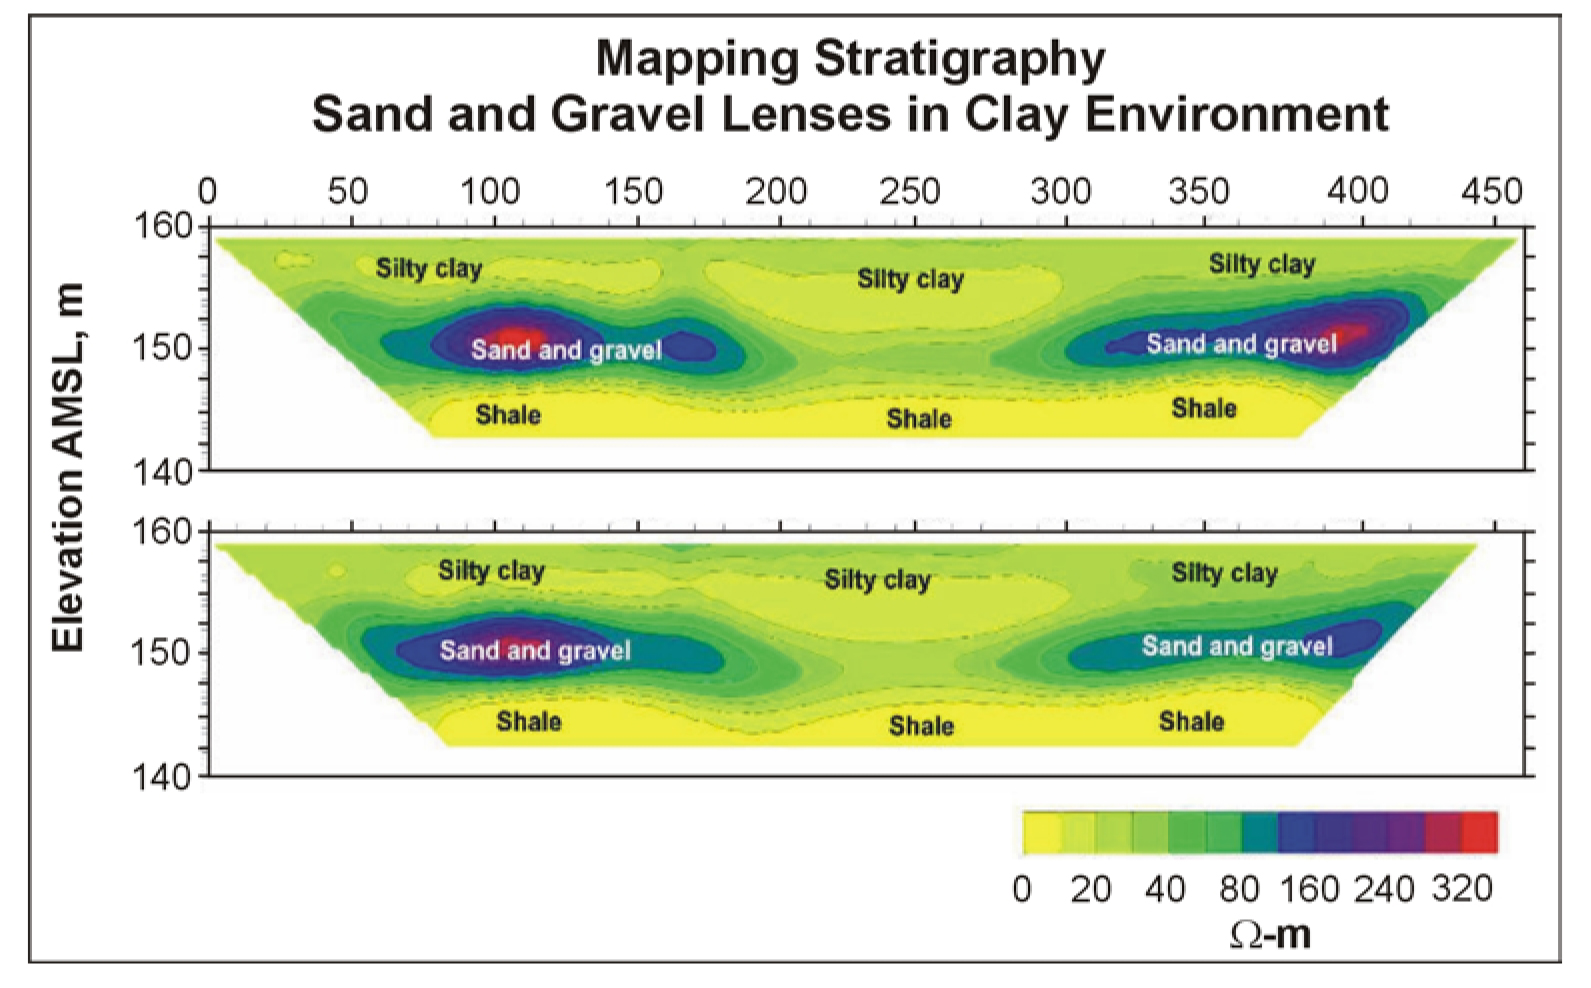
Figure 149. Resistivity data showing stratigraphic changes. (Advanced Geosciences, Inc.)
The data show low resistivity areas (less than 20 ohm-m) corresponding to silty clay layers and high resistivity zones (greater than 100 ohm-m) corresponding to sand and gravel lenses. Unlike the resistivity sounding method, this interpretation does not require that the ground be horizontally layered. Therefore, the interpreted resistivity values are probably better estimates of the true resistivities than those from the sounding method.
Advantages: Automated resistivity systems record a large amount of data allowing relatively detailed interpretations.
Limitations: Since electrodes have to be inserted into the ground, the method is difficult to use in areas where the surface is hard, such as concrete or asphalt-covered areas. If the ground is dry, water may need to be poured on the electrodes to improve the electrical contact between the electrode and the ground. If the data are conducted along one line, resistivity changes normal to the line are not accounted for. However, recording lines parallel to each other can rectify this problem. Three-dimensional surveys can also be recorded.
Cultural features such as power lines, fences, and other metal features may provide false anomalies. These cultural features will have to be noted in the field and accounted for in the interpretation.
Resistivity Soundings
Resistivity soundings can be recorded using any of the electrode arrays shown in figure 90. However, the Schlumberger array is probably most commonly used for soundings and is discussed below. Figure 91 shows the Schlumberger electrode array being used to record resistivity data (figure 91a). Resistivity sounding data obtained using the Schlumberger array are often called Schlumberger soundings. Using data from several electrode spacings, a graph of measured resistivity against electrode spacing is plotted (figure 91b). This graph can be interpreted to provide the depths and resistivities of the layers indicated in the sounding curve. Although it may be possible to infer the rock type from the resistivity sounding interpretation, it is unlikely that the clay content can be estimated with reasonable accuracy from these data. In addition, the interpretation of the method assumes a horizontally layered geology exists with no lateral variations in resistivity. If this is not the case, then the interpreted resistivities and depths may be incorrect.
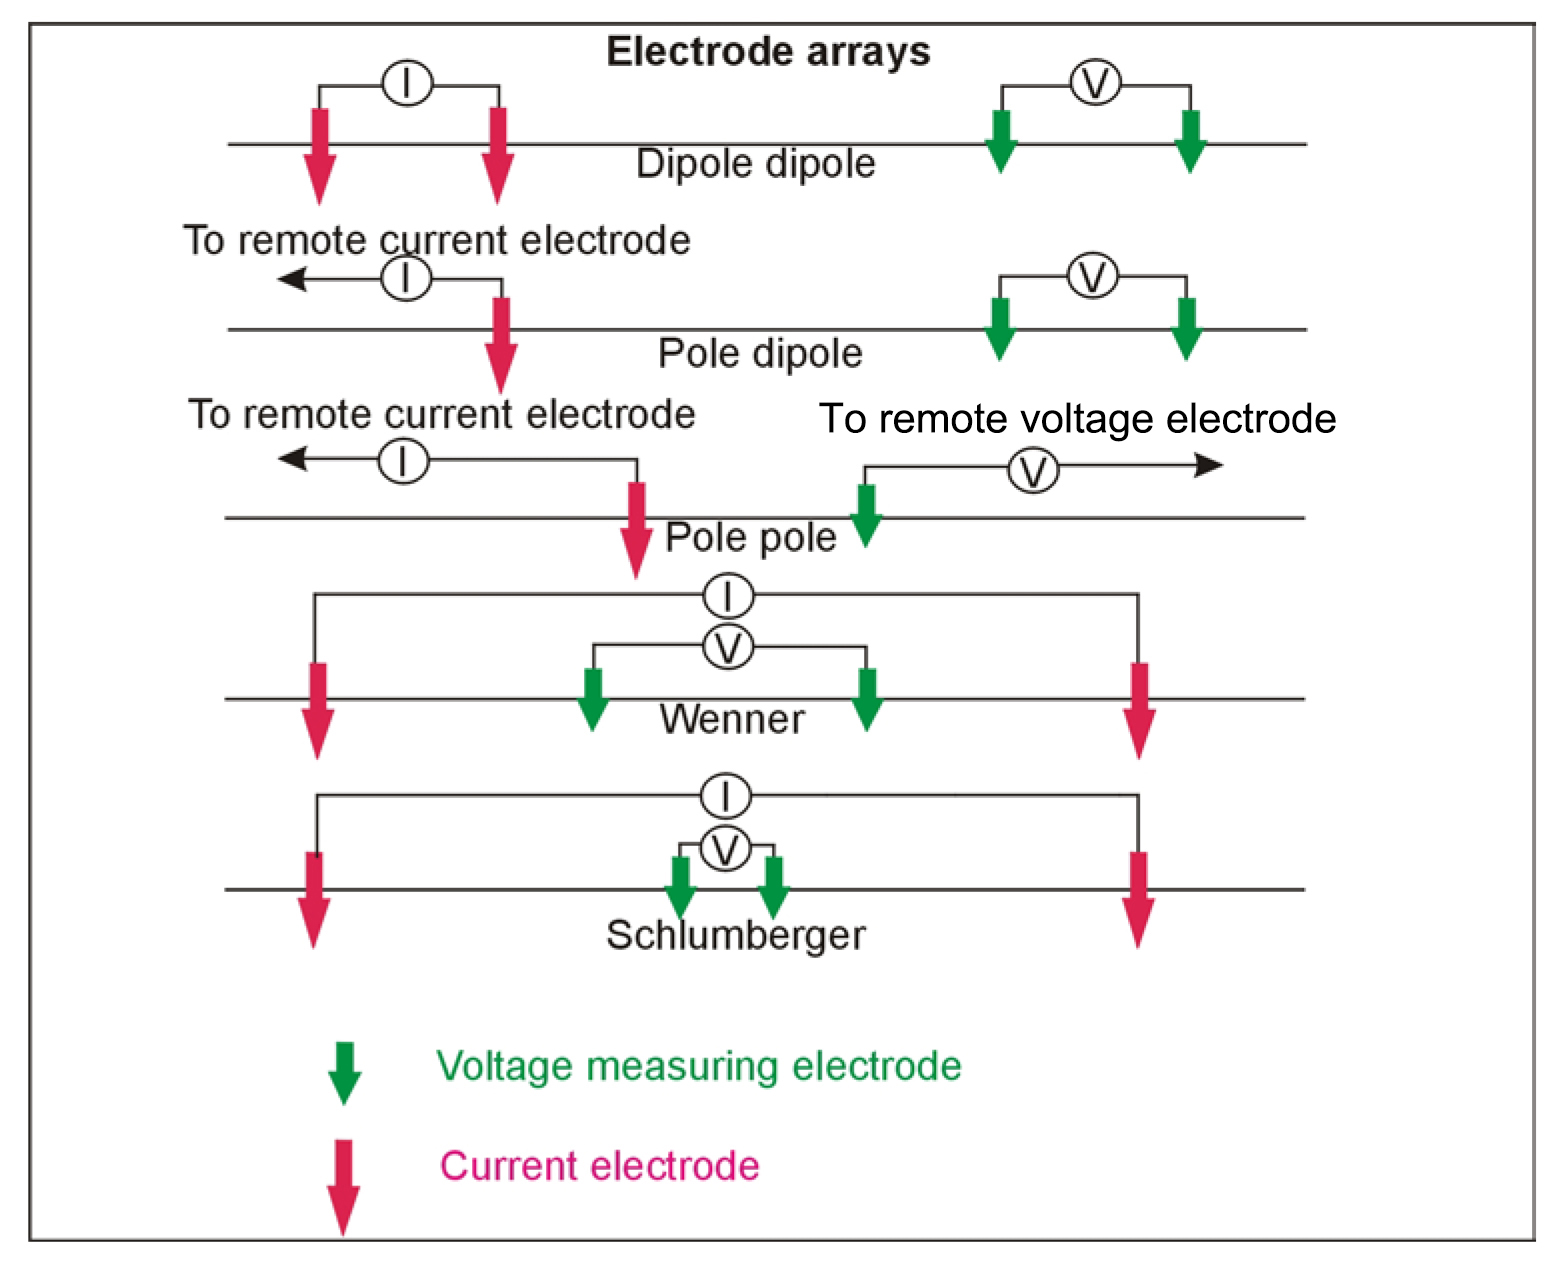
Figure 90. Electrode arrays used to measure resistivity.
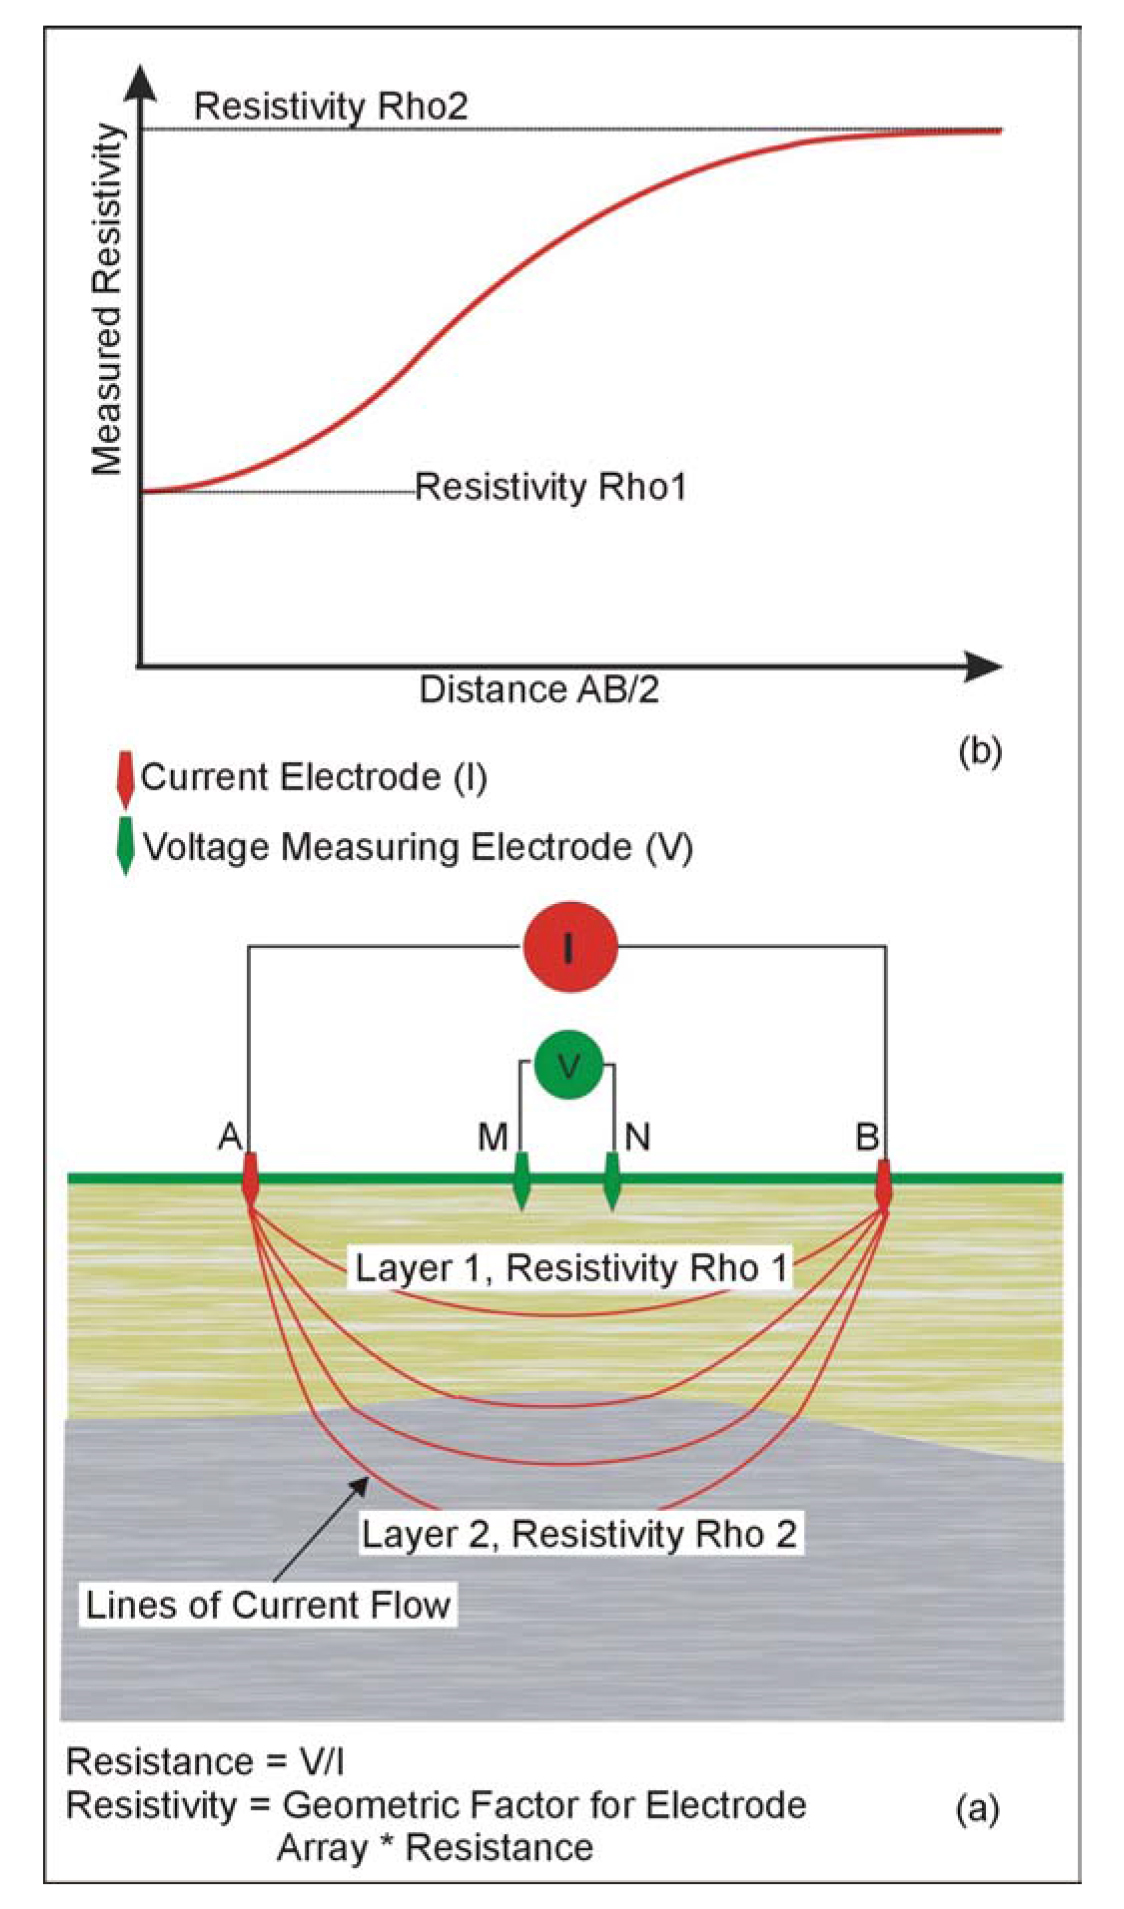
Figure 91. Electrode array for (a) measuring the resistivity of the ground, and (b) a resistivity sounding curve.
Time Domain Electromagnetic Soundings
Basic Concept: Time Domain Electromagnetic (TDEM) soundings are another method for obtaining the vertical distribution of the resistivity of the ground.
This method is particularly well suited to mapping conductive layers. To a significant degree, this method has now superseded the resistivity sounding method since it requires less work for a given investigation depth and generally provides more precise depth estimates. However, resistivity soundings are still useful for shallow investigations or when resistive targets are sought. Figure 120 provides a conceptual drawing of the TDEM method.
A square loop of wire is laid on the ground surface. The side length of this loop is about half of the desired depth of investigation. A receiver coil is placed in the center of the transmitter loop. Electrical current is passed through the transmitter loop and then quickly turned off. This sudden change in the transmitter current causes secondary currents to be generated in the ground. The currents in a conductive layer decay more slowly than those in a resistive layer. However, the relation between decay time, layer conductivity, and depth is complex, although, generally, longer decay times are related to greater depths. Thus, the conductive layer (shale) will generate currents that decay more slowly than those in the more resistive layer.
The voltage measured by the receiver coil does not decay instantly to zero when the current is turned off but continues to decay for some time caused by the decaying secondary electrical currents in the ground. The voltage measured by the receiver is then converted to resistivity. A plot is made of the measured resistivity against the time after the transmitter current is turned off (delay time), as illustrated in figure 121.
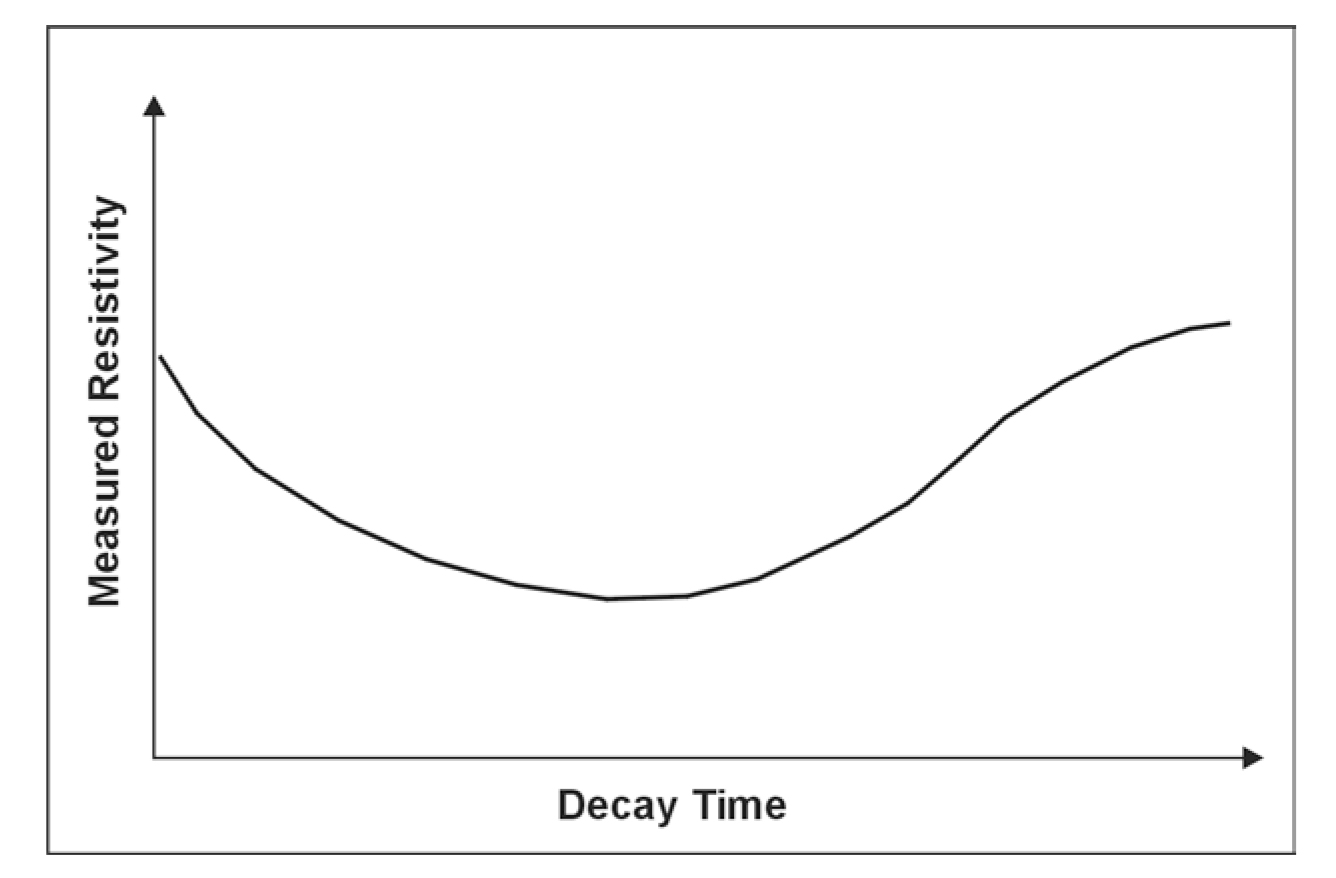
Figure 121. A Time Domain Electromagnetic Sounding curve.
The resistivity sounding curve shown in figure 121 illustrates the curve that would be obtained over three-layered ground. The near-surface layer is fairly resistive. This is followed by a layer having a much lower resistivity (higher conductivity) and causes the measured resistivity values to decrease. The third layer is again resistive.
Data Acquisition: A transmitter loop and receiver coil are laid out as described earlier. Switched current, as described above, is passed through the transmitter loop, and the resulting voltage is measured by the receiver coil. The switching and measuring procedure is repeated many times, allowing the resulting voltages to be stacked and improving the signal-to-noise ratio. This procedure is repeated at different sounding locations until the area of interest has been covered. A sounding curve is plotted for each location showing the measured resistivity against delay time.
Data Processing: Probably the only processing required is the removal of bad data points.
Data Interpretation: This sounding curve is interpreted using computer software to provide a model showing the layer resistivities and thickness. The interpreter inputs a preliminary model into this software program that calculates the sounding curve for this model. It adjusts the model and calculates a new sounding curve that better fits the field data. This process is repeated until a satisfactory fit is obtained between the model and the field data, a process is called inversion. The sounding curve shown in figure 121 illustrates the type of curve expected over a conductive shale layer.
Advantages: The TDEM method is good at determining the resistivity of the ground for depths greater than about 10 meters, depending on the near surface resistivity. Interpreted depths to interfaces are generally more accurate than those for resistivity soundings, especially for conductive layers.
Limitations: TDEM soundings are an efficient method to investigate the vertical distribution of ground resistivity. Generally, the method is better suited to mapping conductive formations than resistive formations. However, since the desired targets in this section are clays, which are usually conductive, then this may not be a limitation.
Probably the most troublesome aspect of data recording is the influence of metal objects such as fences, power lines, and other "cultural" features at the survey site.
Induced Polarization
Basic Concept: Induced Polarization (IP) is an electrical method that measures the change in the measured resistivity of the ground with frequency. All of the electrode arrays used to measure resistivity (see figure 90) can also be used to measure IP. In fact, when measuring IP, resistivity is also measured. There are two methods used to record IP measurements: time domain and frequency domain. In time domain, a constant current is passed into the ground for a short time (seconds) using two of the four electrodes and then rapidly switched off. During this off time, the remaining two electrodes measure the resulting voltage. If an IP effect is present, the voltage across these electrodes will not suddenly return to zero as the current is turned off, but will decay to zero over a period of time, usually within a few seconds. Figure 110 illustrates the concept. Simple IP measurements usually integrate the IP voltage over a specified time, say T1 and T2 (figure 110), providing a single number that is a measure of the IP response, called chargeability with units of mV/V.
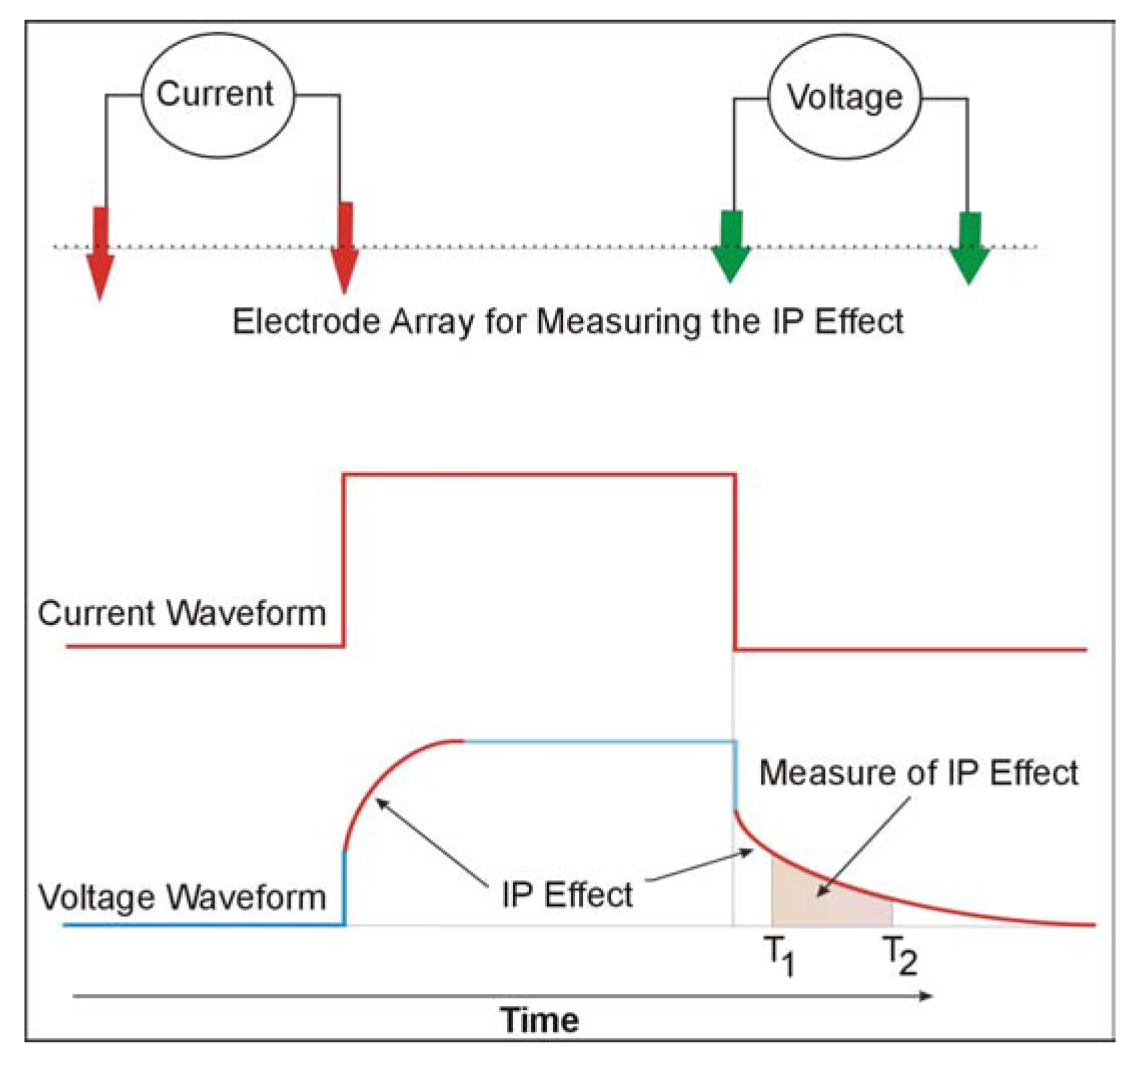
Figure 110. Induced Polarization waveform.
IP phenomena occur over clays, metallic minerals, and graphite zones. It is also observed near fences and other electrically grounded metallic features, either on the ground surface or buried, such as metal pipelines. The IP effect resulting from clay is discussed in the introduction to this section and involves Membrane Polarization.
Data Acquisition: Induced Polarization surveys are conducted much like resistivity surveys with readings taken at discrete stations to form lines of data crossing the area of interest.
The automated resistivity systems discussed previously can also be used to record IP data. Figure 151 illustrates one of the systems that can be used to record IP data using a multi-electrode system. If digital data are obtained at several frequencies, the variation of IP response with frequency is obtained. To get the frequency domain response in the time domain, the current and voltage waveforms have to be digitally recorded, and a Fourier analysis of the data performed providing the variation of resistivity with frequency, called Spectral Induced Polarization (SIP). This provides more interpretable information than the simple IP measure discussed above. However, this is still being researched and is rarely used as a production method.
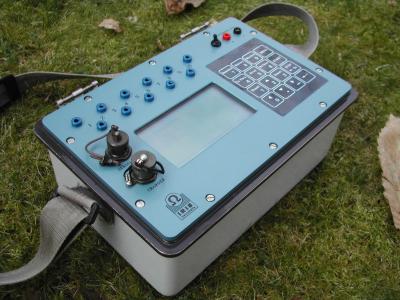
Figure 151. Induced Polarization instrument. (IRS Instruments)
Data Processing: Both the resistivity and IP data are usually plotted to form a pseudosection.

Figure 152. Chargeability pseudosection. (Terraplus, Inc.)
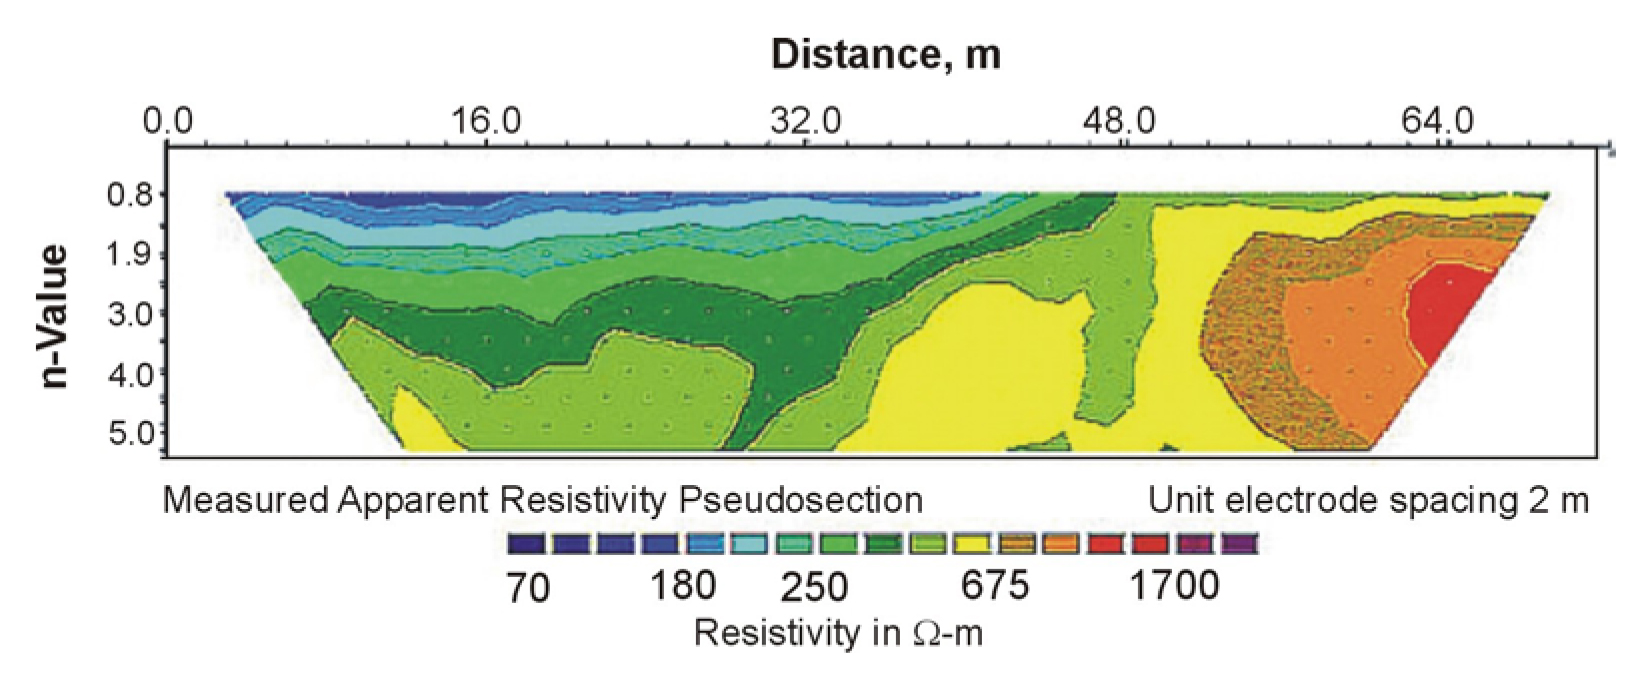
Figure 153. Measured (apparent) resistivity pseudosection. (Terraplus, Inc.)
Data Interpretation: Although these data are from a shallow survey using small electrode spacings, it does illustrate the method, presentation techniques, and the interpretation. Surveys to much greater depths can be performed using larger electrode spacings.
Although the literature often refers to the use of the IP method for locating clays, no references were found showing the correlation between clay content and the magnitude of either the simple or spectral IP response. This method appears to have promise for investigating clay content, and w ould probably benefit from additional research.
Since resistivity measurements are also obtained when recording IP data, these two parameters can be used to determine the occurrence of clay and possibly map the clay content.
Advantages: The IP method is reported to respond to clay providing a higher IP response in their presence. If this is so this may be the only method that, in the right environment, may provide a unique clay response.
Limitations: The IP method is fairly labor intensive and requires electrodes to be inserted into the ground. Generally, because the method requires more electrical current than the resistivity method, the contact resistance (resistance of the electrode to ground) of the electrodes usually has to be lower than that for an equivalent resistivity survey. Thus, the electrodes may have to be inserted to greater depths or saturated with water to improve the electrical contact between the electrode and the ground. If the ground surface is hard (concrete or asphalt), additional work has to be done to insert the electrodes. If Spectral IP measurements are required, additional care needs to be taken since the desired voltages may be very small, depending on the specifications of the recording parameters.