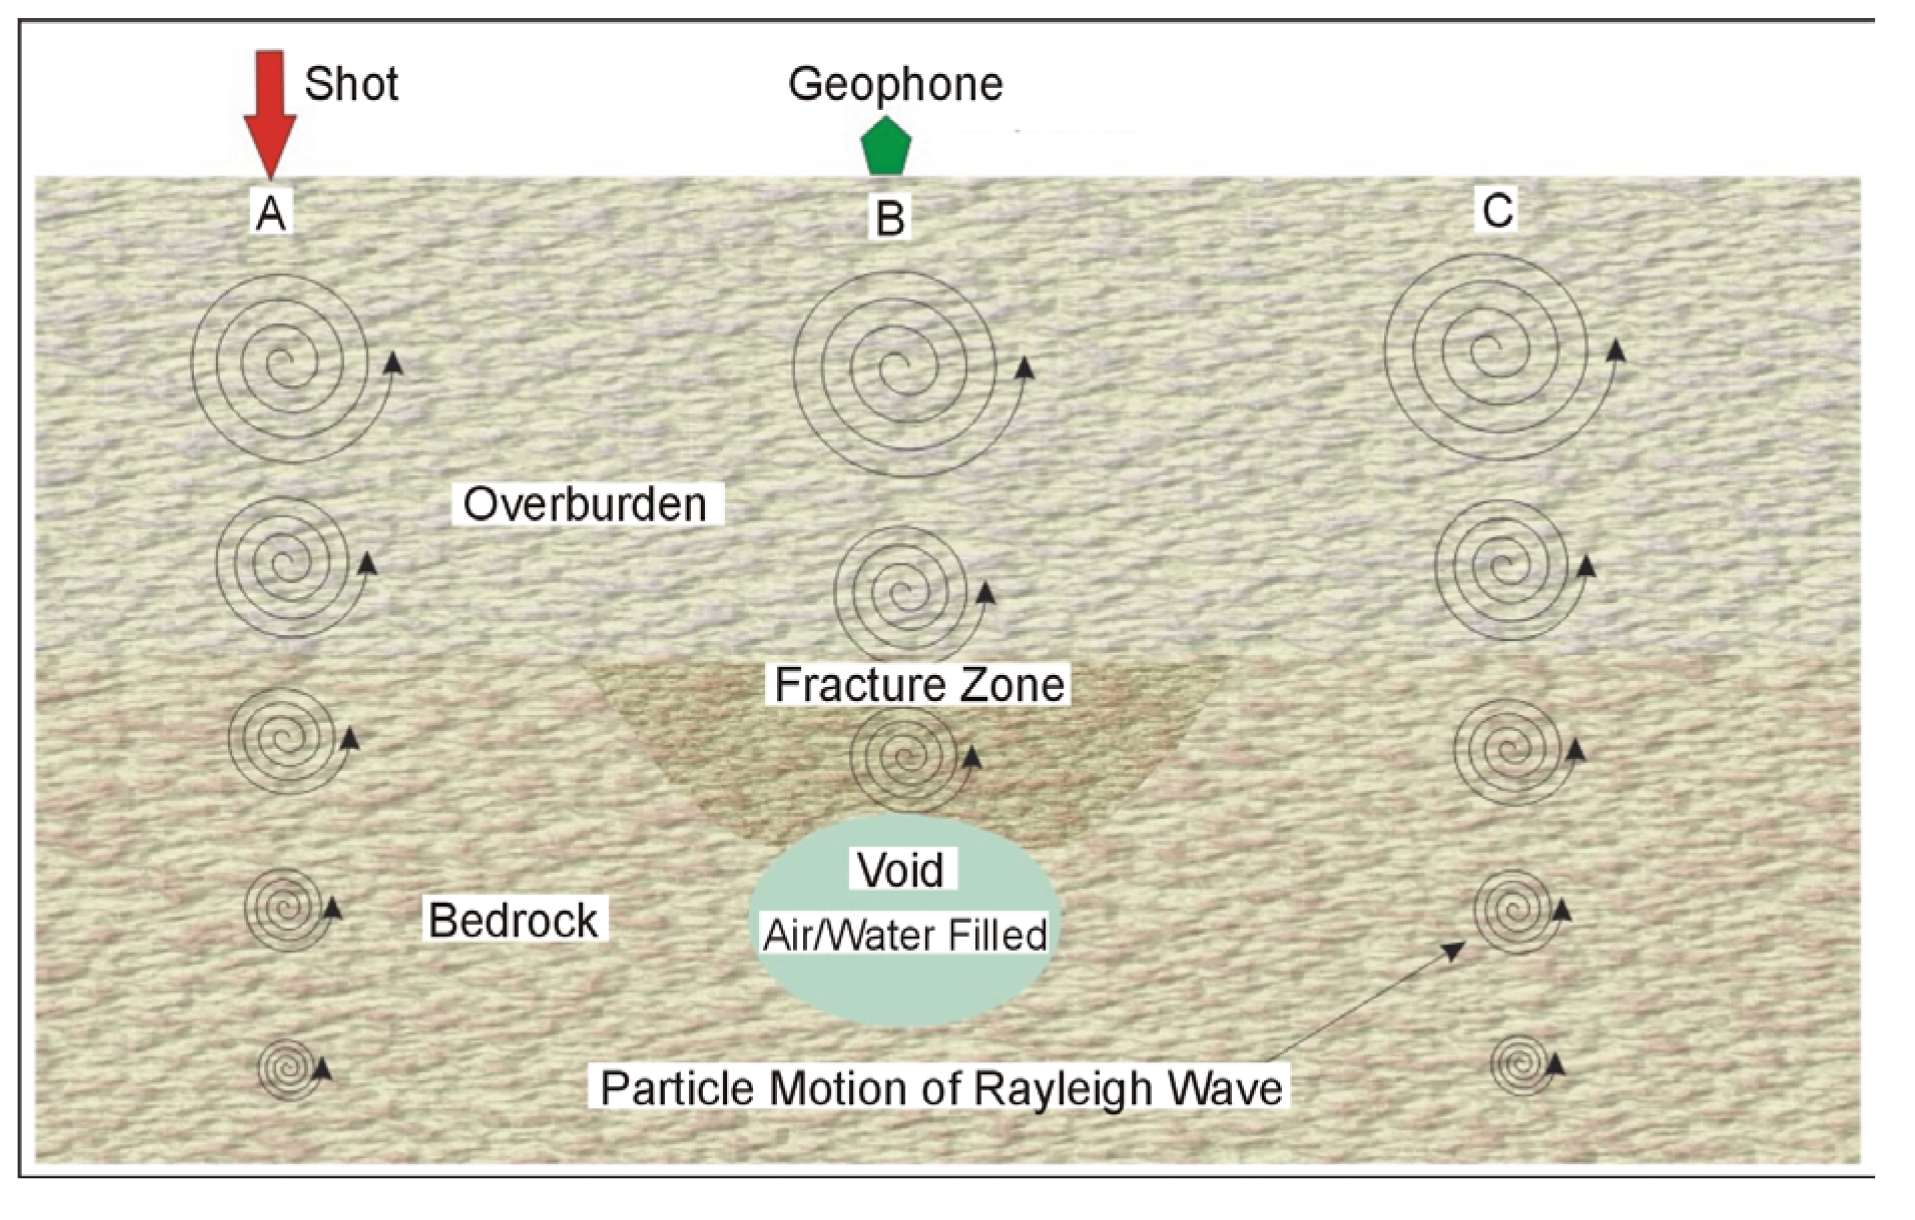
Basic Concept: This method uses Rayleigh waves to detect fracture zones and associated voids. Rayleigh waves, also known as surface waves, have a particle motion that is counterclockwise with respect to the direction of travel. Figure 99 illustrates the particle motion for Rayleigh waves traveling in the positive X direction. In addition, the particle displacement is greatest at the ground surface, near the Rayleigh wave source, and decreases with depth. Three shot points are shown, labeled A, B, and C. The particle motion and displacement are shown for five depths under each shot point. For shot B over the void, no Rayleigh waves are transmitted through the water/air-filled void. This affects the measured Rayleigh wave recorded by the geophones over the void. Four parameters are usually observed. The first is an increase in the travel time of the Rayleigh wave as the fracture zone above the void is crossed. The second parameter is a decrease in the amplitude of the Rayleigh wave. The third parameter is reverberations (sometimes called ringing) as the void is crossed. The fourth parameter is a shift in the peak frequency toward lower frequencies. This is caused by trapped waves. The effective depth of penetration is approximately one-third to one-half of the wavelength of the Rayleigh wave.

Figure 99. Rayleigh wave particle motion and displacement over a void.
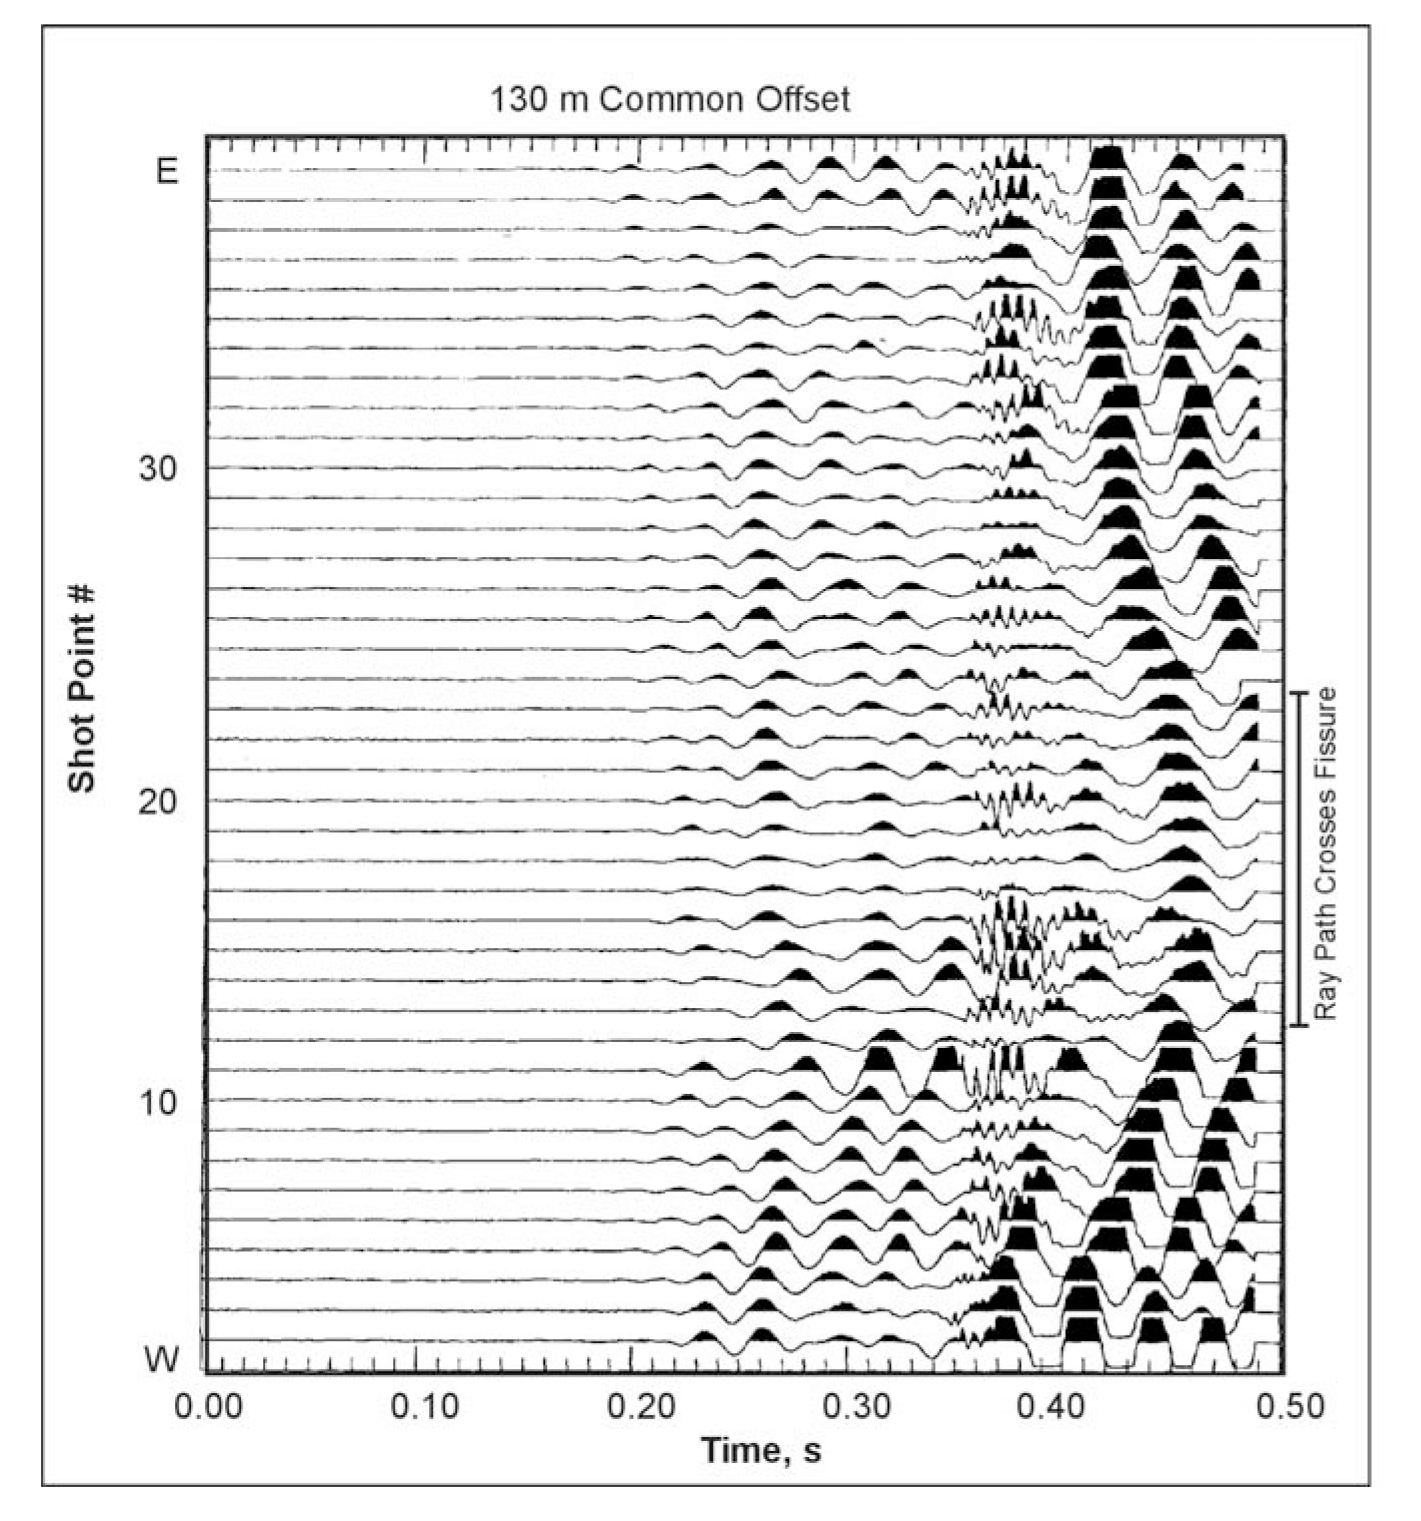
Data Acquisition: Rayleigh waves are created by any impact source. For shallow investigations, a hammer is all that is needed. Data are recorded using one geophone and one shot point. The distance between the shot and geophone depends on the depth of investigation and is usually about twice the expected target depth. Data are recorded at regular intervals across the traverse while maintaining the same shot-geophone separation. The interval between stations depends on the expected size of the void/fracture zone and the desired resolution. Generally, in order to clearly see the void/fracture zone, it is desirable to have several stations that cross the area of interest. Figure 100 presents data from a common offset Rayleigh wave survey over a void/fracture zone in an alluvial basin.
The geophone traces are drawn horizontally with the vertical axis being distance (shot stations).
Data Processing: The data may be filtered to highlight the Rayleigh wave frequencies and is then plotted as shown on Figure 100.
Data Interpretation: If the frequency content of each trace is obtained then the tendency towards lower frequencies over a fracture/void can be observed. The data shown in Figure 100 illustrates many of the features expected over a void/fracture. The travel time to the first arrival of the Rayleigh wave is greater across the void/fracture and is wider than the actual fractured zone. The amplitudes of the Rayleigh waves decrease as the zone is crossed. In addition, the wavelength of the signals over the void/fracture is longer than those over unfractured rock, showing that the high frequencies have been attenuated. Since the records are not long enough, the ringing effect is not observed in this data.

Figure 100. Data from a Rayleigh wave survey over a void/fracture zone.
Advantages: The field data recording is simple and requires much less effort for a given line length than the seismic refraction method.
Limitations: The method responds to the bulk seismic properties of the rocks and soil, which are influenced by factors other than voids. It has a limited depth of penetration and resolution. Penetration depth is limited by the wavelengths generated by the seismic source. However, this method is faster and less costly than most other seismic methods.