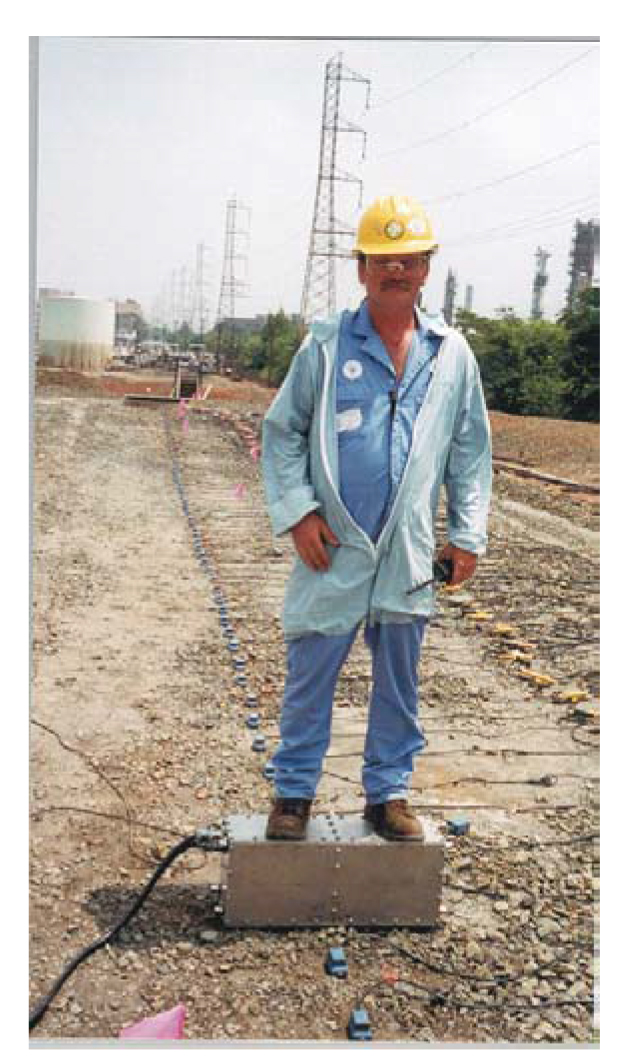
Basic Concept: Voids can be detected using seismic shear wave reflection surveys. These surveys are conducted in much the same manner as compressional wave seismic reflection surveys, except that a shear wave source has to be used. One such source is called the Microvib and is shown in Figure 95.
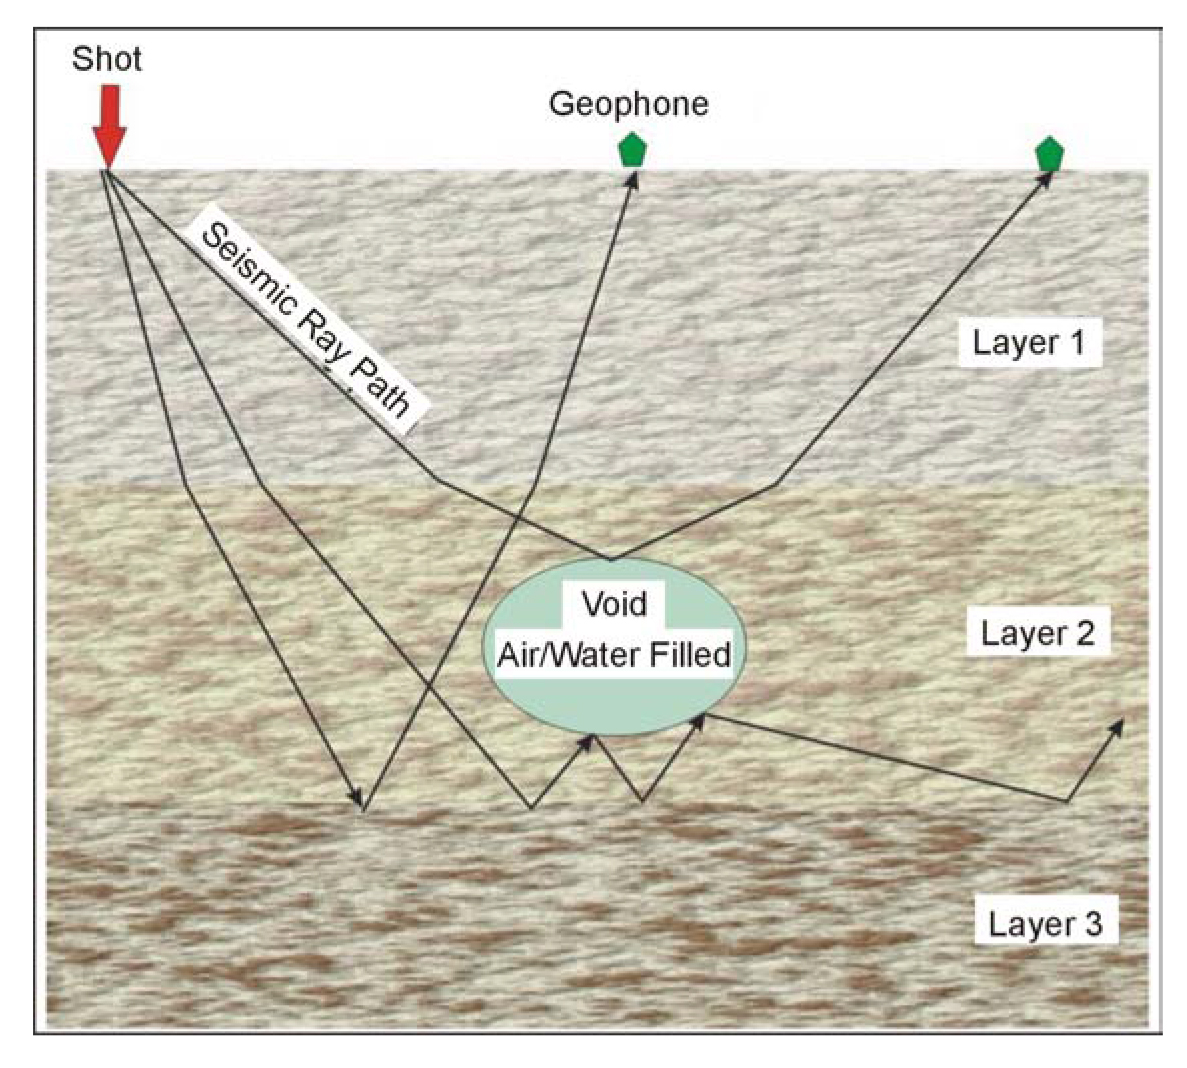
The seismic waves travel into the overburden and bedrock and are influenced by the void as is illustrated in Figure 96.
Rays that encounter the upper surface of the void are reflected back to the ground surface. There is no transmission of the wave through the void because shear waves are not transmitted through air or water. Rays that do not encounter the void are reflected from the deeper layer as expected; however, rays that encounter the lower surface of the void are reflected back to the deeper reflector. Again, since air or water do not support shear waves, they are not transmitted through the expected void.

Figure 95. The Microvib shear wave generator. (Bay Geophysical)

Figure 96. Ray paths for shear waves over a water/air-filled void.
Data Acquisition: Shear wave reflection surveys are conducted in much the same way as compressional wave surveys. Probably the most important difference is that the geophone spacing will be smaller for an equivalent depth of investigation, since the velocity of shear waves is only about 0.6 times that of compressional waves. The geophone spacing and spread length are also dependent on the expected depth and size of the void. Another important quantity to consider is the frequency, and, hence, wavelength, of the shear waves. The higher the frequency, the smaller the voids that are be detected. However, higher frequencies also attenuate faster and have less depth penetration. A very rough estimate is to keep the wavelength no greater than about 0.25 times the dimensions of the void.
Data Processing: Data processing is essentially the same as for reflection seismic surveys. With vibrational sources, such as the Microvib, special processing techniques have to be applied to transform the data to that which would have been observed with a conventional impulse type seismic source. The records are then sorted to gathers with a common mid-point. Various kinds of filtering and other processes are then used to refine the data, after which the traces for each gather are summed to produce a single trace whose signal-to-noise ratio is much greater than the unprocessed traces. Once this procedure has been done for all of the traces, a plot can be produced showing the seismic reflectors. Additional processing, such as migration, can also be applied to this data.
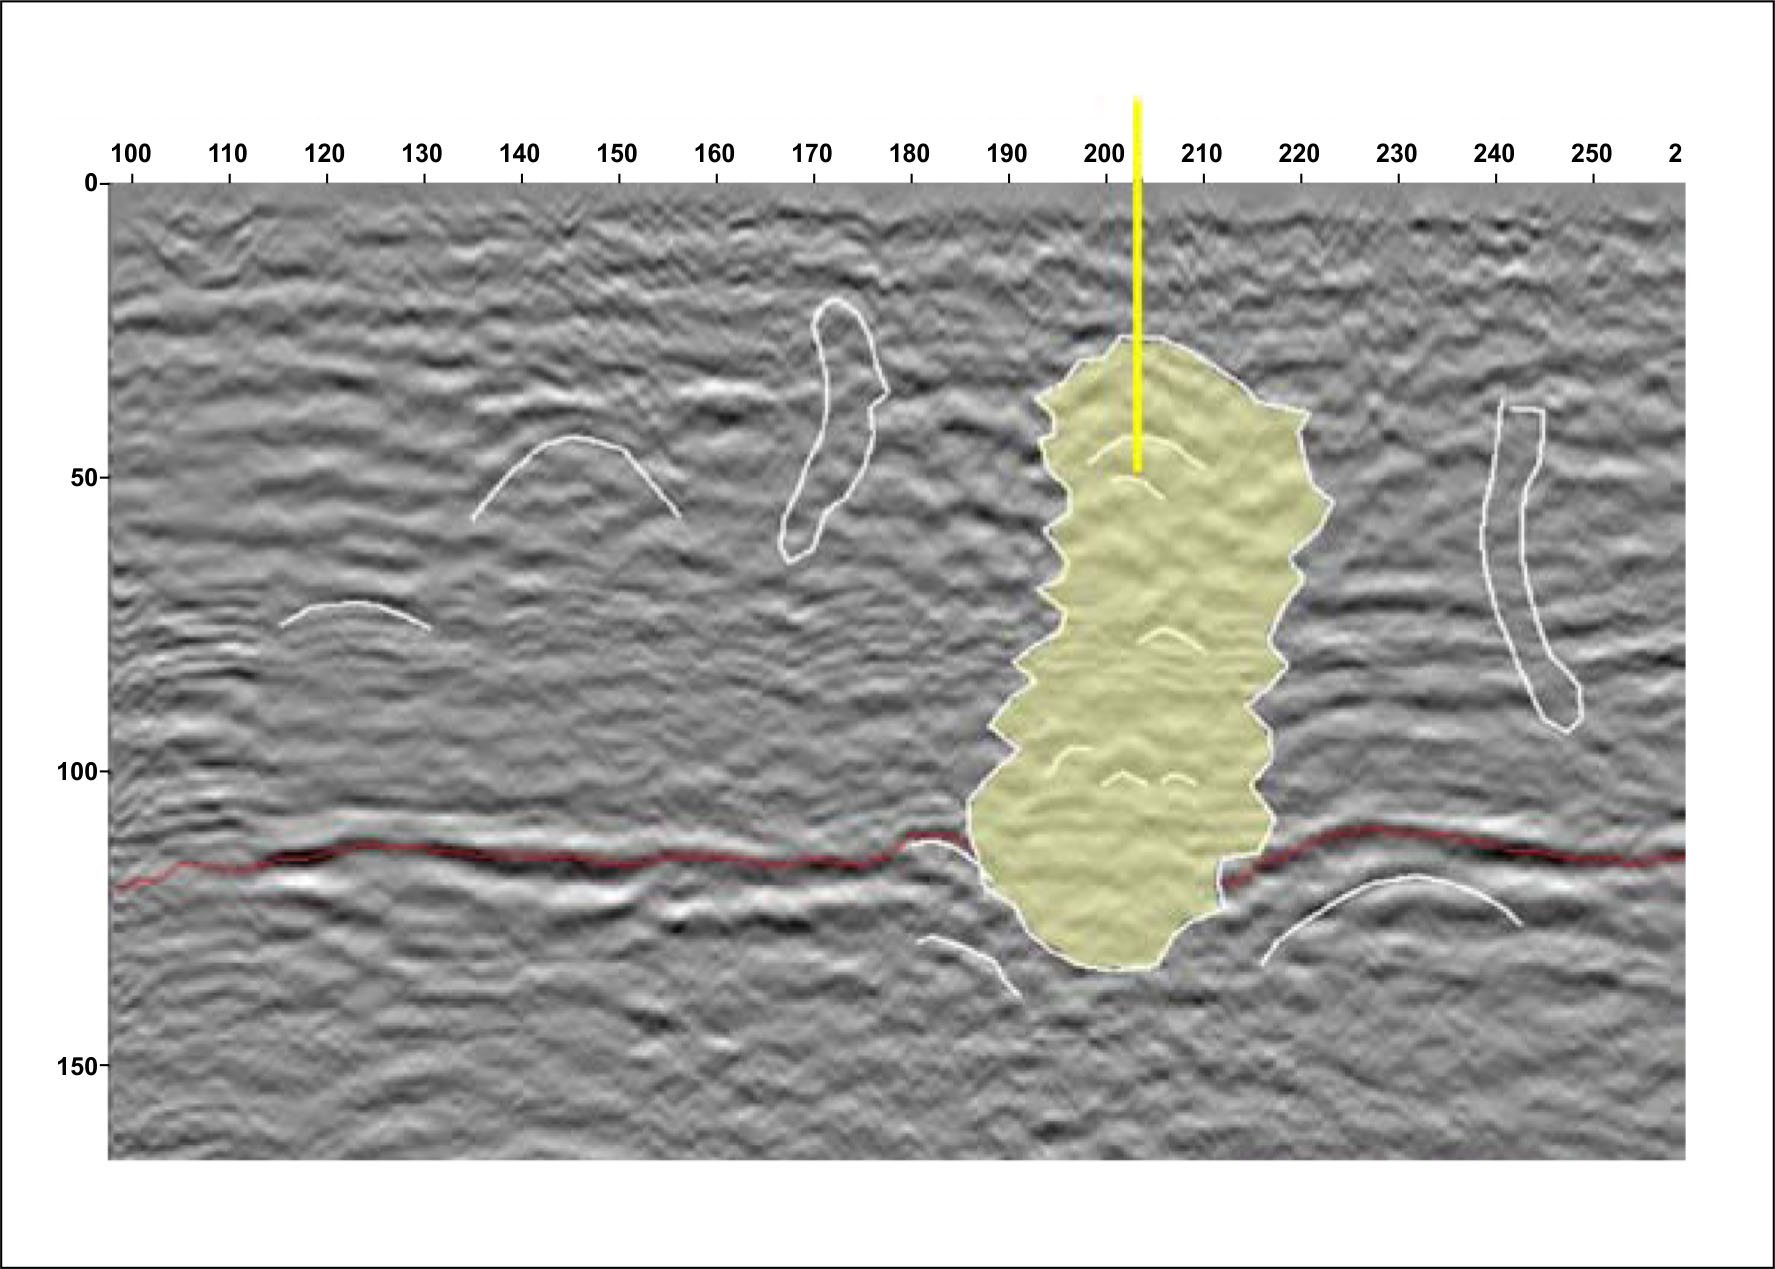
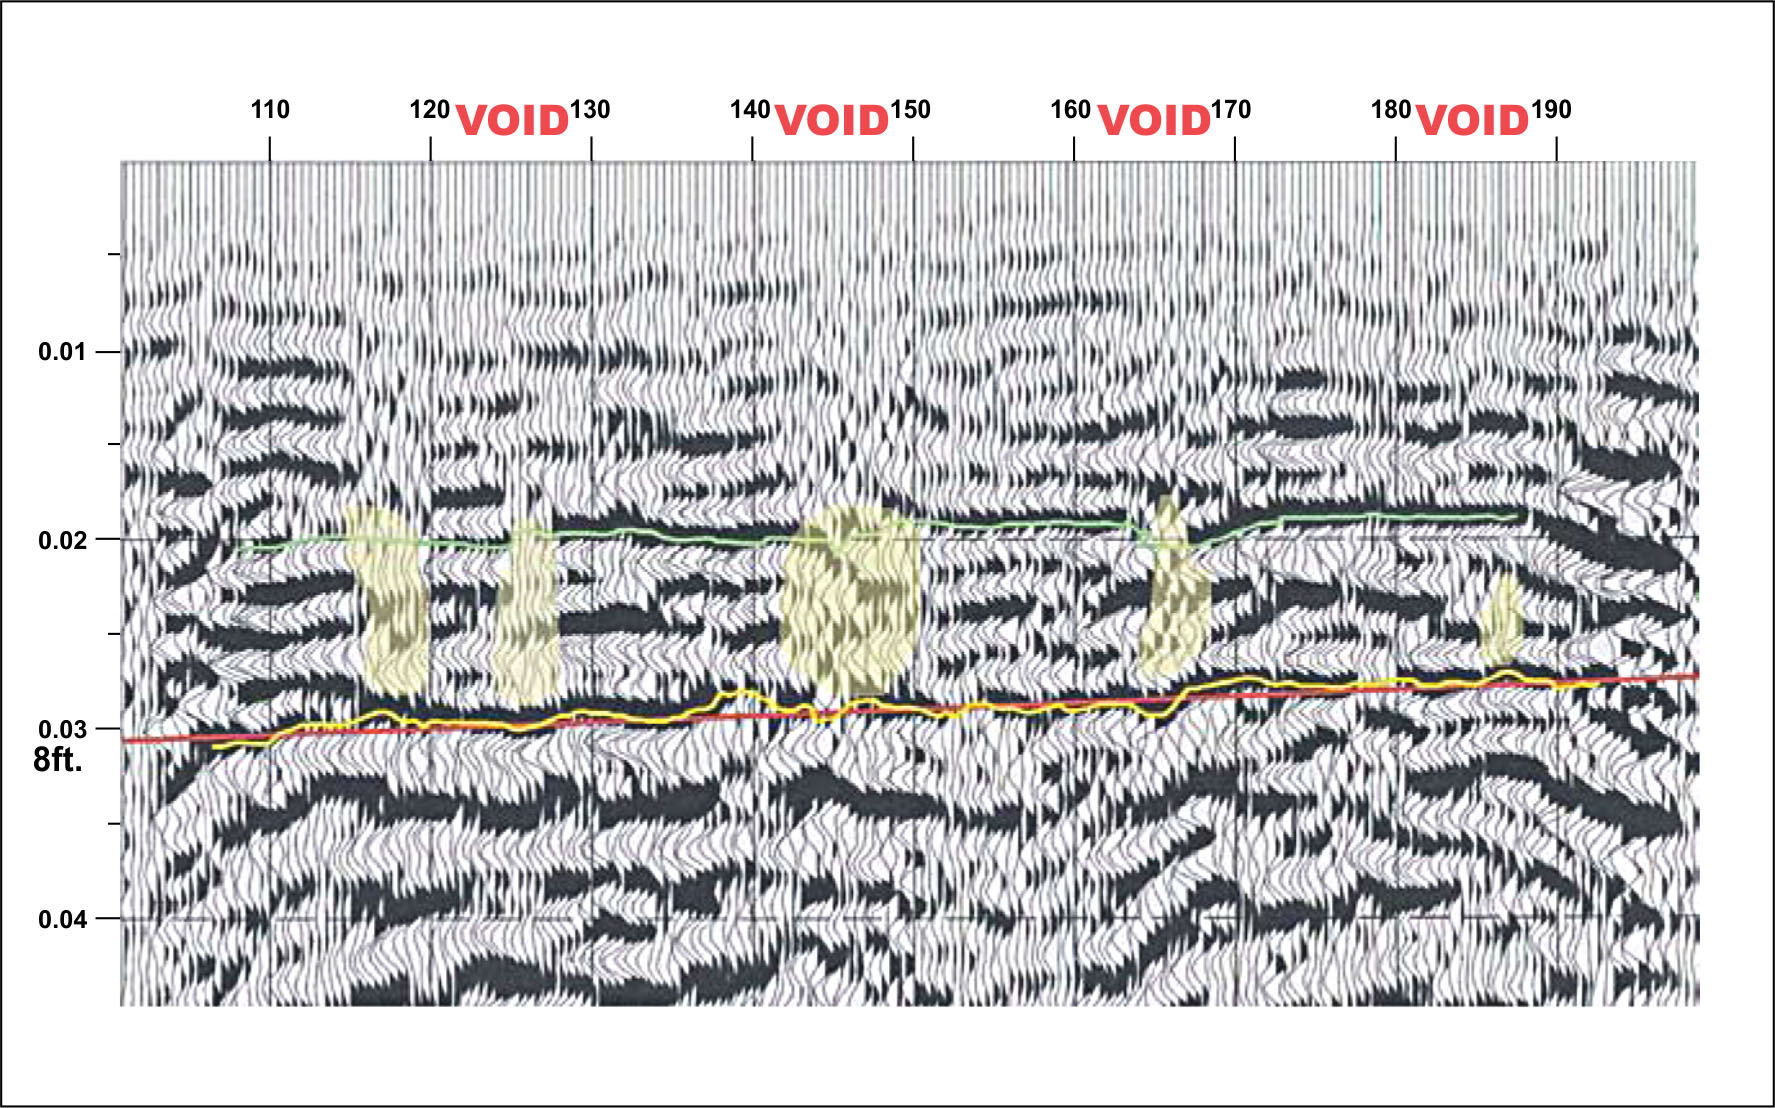
Data Interpretation: Interpretation of the data requires some understanding of the influence of the ray paths, shown in Figure 97, on the final seismic section. The rays that are reflected back to the lower layer do not reach the geophones on the ground surface and cause a lower amplitude signal to be recorded. Thus, voids produce a region in the seismic section where layer continuity decreases, and where amplitudes of the reflected waves are attenuated. Figures 97 and 98 show the results of two shear wave surveys for voids.
In Figure 97, the continuity of the reflector, highlighted in red, is broken at about the center of the section. In addition, the area of reflectors above this main reflector becomes less coherent.

Figure 97. Results from a Microvib survey showing an interpreted void. (Bay Geophysical)

Figure 98. Voids interpreted from shear wave reflection data. (Bay Geophysical)
In Figure 98, a similar situation occurs except there are more reflectors in this section than in the section shown in Figure 97.
In Figure 98, the voids are seen as a disappearance of coherence along the reflectors. As discussed above, this kind of response is expected when reflections from deeper layers are blocked (attenuated) by the void and do not reach the ground surface.
Advantages: The success of the method for locating voids depends on the frequency of the shear waves in the ground. If high frequencies can be generated then relatively small voids may be imaged. Probably one of the best sources in the Microvib since it can provide relatively high frequencies.
Limitations: The shear wave reflection method is quite labor intensive and requires significant processing. Besides the Microvib, there are few shear wave sources for the relatively shallow surveys for voids. There are larger truck-mounted shear wave sources if deeper investigation depths are needed.