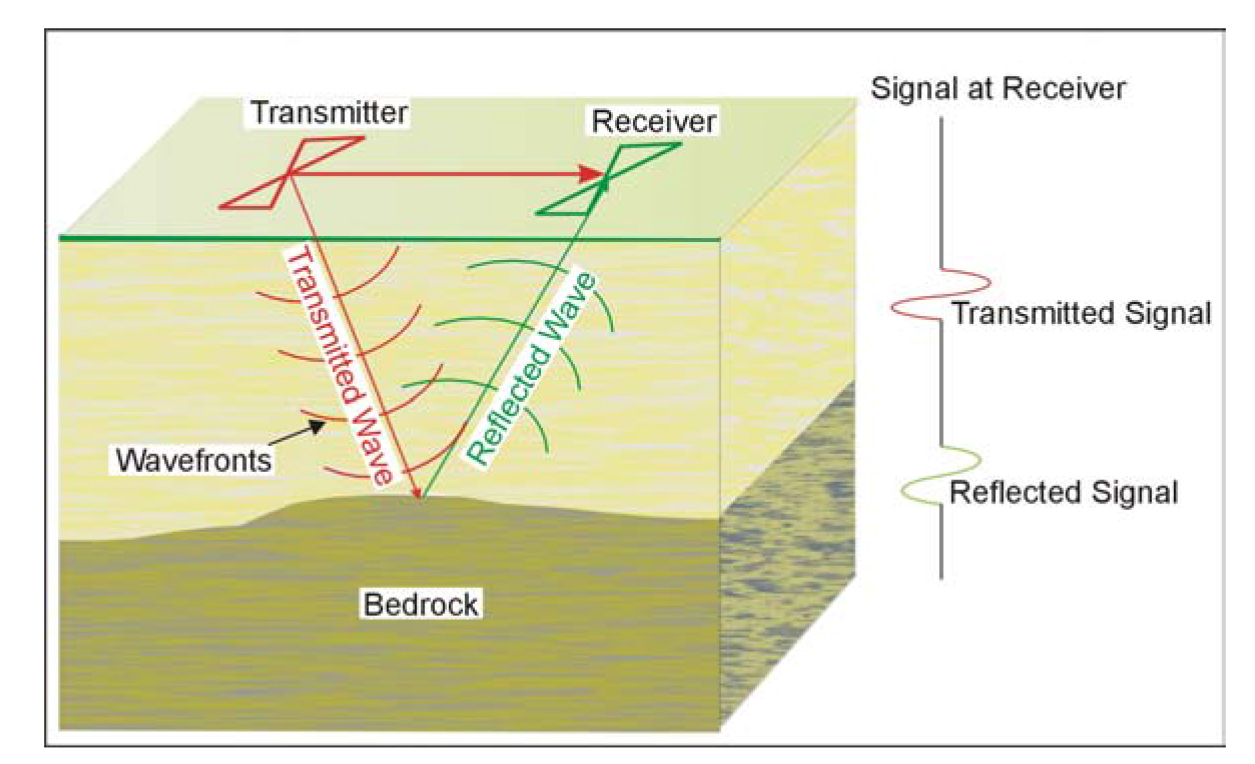
Ground-Penetrating Radar (GPR) transmits and records reflected electromagnetic energy. In bridge scour evaluations, the method can provide an essentially continuous image of the stream channel and the sub-bottom sediment, including the in-filled scour features.
Basic Concept: In the GPR method, a transmitter is used to send electromagnetic energy into the ground that then reflects from geologic interfaces where a dielectric contrast exists. The reflected energy is recorded by a receiver and produces a picture of the reflected waves. If the system is used over water, it will be placed on or immediately above the surface of the water. The transmitter produces short period (frequencies in megahertz range) pulsed electromagnetic signals at regular time or distance intervals as it towed across or above the surface of the water. Some of this pulsed electromagnetic (EM) energy is reflected from the water bottom and other prominent dielectric interfaces (facies contacts) and returned to the receiver. The arrival time and magnitude of the reflected energy are recorded at the surface by the receiver antenna. Traces from adjacent source locations are generally plotted side-by-side to form an essentially continuous time-depth profile of the stream bottom and shallow sub-strata (including in-filled scour features). Estimated EM velocities can be used to transform the time-depth profile into a depth profile. Velocities are a function of suspended sediment load and can vary appreciably. Figure 111 shows the GPR transmitter and receiver along with the transmitted and reflected waves.

Figure 111. Ground Penetrating Radar System.
GPR can be used with different antenna providing different frequencies, varying between 25 and 1500 MHz. A lower frequency antenna provides greater penetration depths but lower resolution. A higher frequency antenna provides less depth penetration but has better resolution. A GPR controller/data recorder and antenna are illustrated Ground Penetrating Radar.
Data Acquisition: In this application, the GPR system will have to be traversed over the water surface. Typically, a GPR system is placed in a small rubber boat that is towed with a motorized boat. The data recording equipment is placed in the towboat, and a GPS antenna could be attached to the rubber boat, providing its position. Care will be required close to the piers in case of debris, which may be caught around the pier along with the stronger current flow that may occur around the pier.
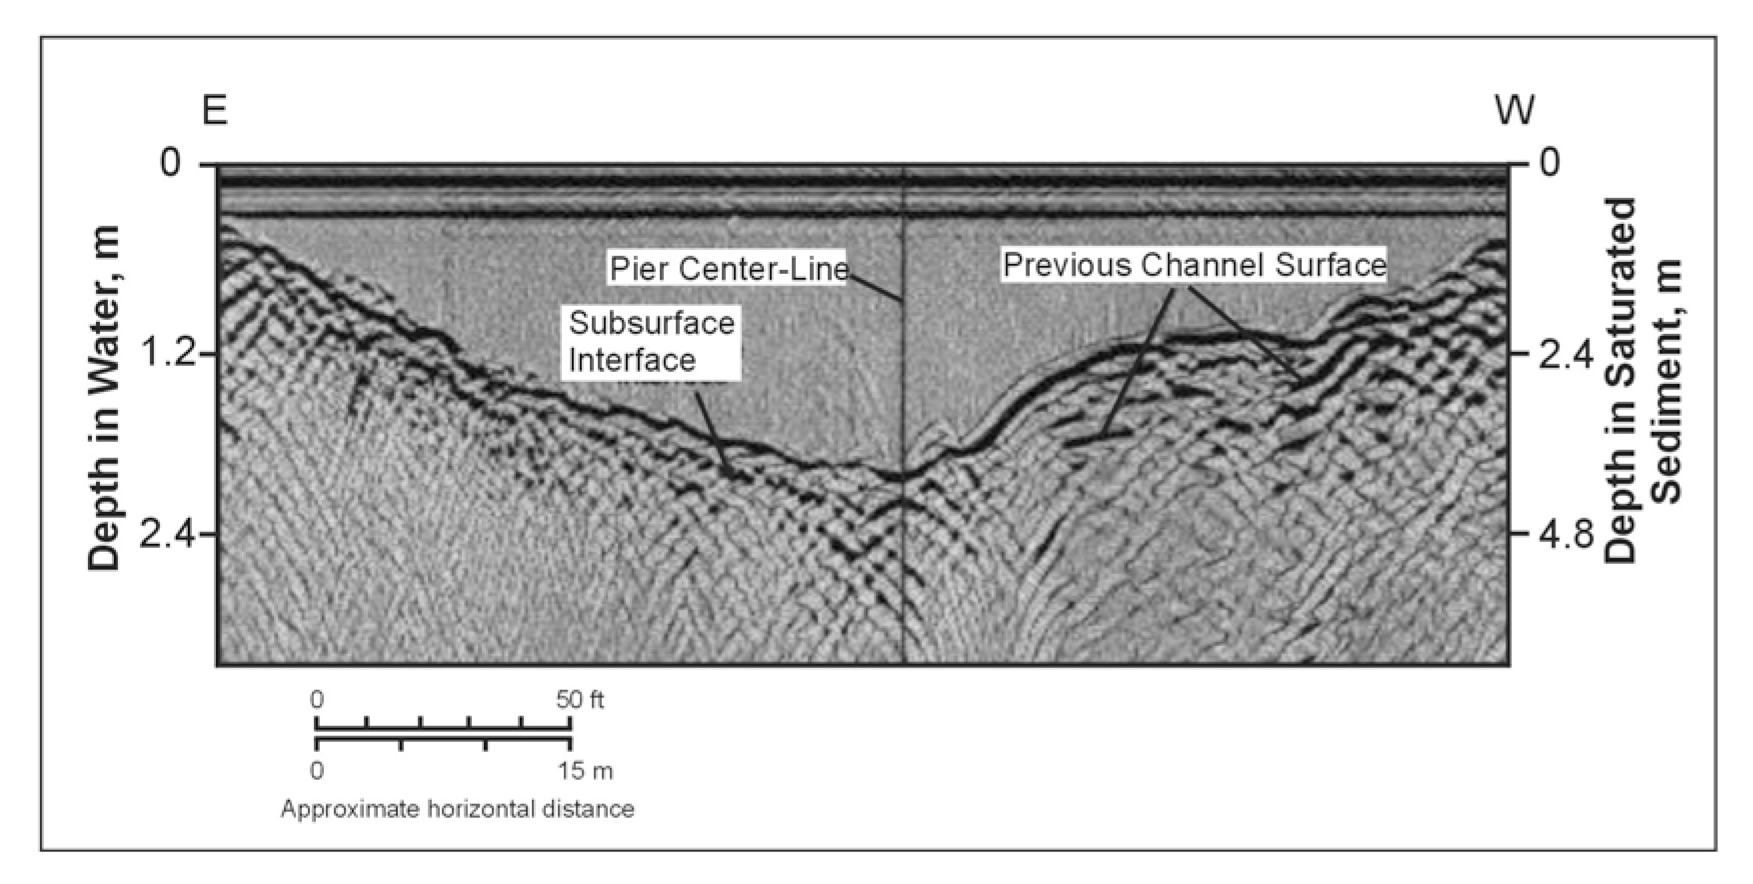
Unprocessed GPR data collected close to a pier is illustrated in figure 55. Figure 56 shows the same data processed using digital filtering and migration.

Figure 55. Unprocessed 300 MHz Ground Penetrating Radar data collected 2 feet upstream from a pier. (Placzek, et al. 1995, USGS Report 95-4009)

Figure 56. Digitally filtered and migrated 300 MHz Ground Penetrating Radar data.(Placzek, et al. 1995, USGS Report 95-4009)
Another example of GPR data is shown below in figure 57. In these data, a scour hole can be seen close to the upstream edge of the pier. On the downstream side, a pile of fill is seen.
Data Processing: GPR data can be viewed without any processing. However, some processing is often desirable. The common processing steps used are:
- Distance normalization
- Horizontal scaling (stacking)
- Vertical frequency filtering
- Horizontal filtering
- Velocity corrections
- Migration
- Gain

Figure 57. Unpositioned 300 MHz Ground Penetrating Radar data collected four feet from a central pier. (Placzek, et al. 1995, USGS Report 95-4009)
The above processing steps usually increase the interpretability of the GPR profiles by removing unwanted random noise and enhancing the amplitude events of interest. Figure 57 shows the changes in a GPR profile as these processing steps are applied.
Advantages: The main advantages of the GPR profiling tool are as follows:
- The GPR antennae are non-invasive and can be moved rapidly across (or above) the surface of a stream at the discretion of the operator. The GPR tool does not need to be physically coupled to the water surface and can be operated remotely, ensuring that neither the operator nor equipment need be endangered by floodwaters. Profiles can be extended across emerged sand bars or onto the shore.
- The tool can provide an accurate depth-structure model of the water bottom and sub-bottom sediments (to depths on the order of 9 m). Post acquisition processing (migration) can be applied.
- Lithologic/facies units with thickness on the order of 0.1 m can be imaged with intermediate-frequency units (200 MHz).
Limitations: The main limitations of the GPR profiling tool are as follows:
- The equipment is relatively expensive (hardware and software).
- Data may be contaminated by noise (multiple reflections and echoes from pier footings).
- Post-acquisition processing (migration) may be required in areas where significant structural relief is present.
- GPR is not normally effective when water depths exceed 9 m.
- GPR cannot be used in saline waters.

Figure 58. Ground Penetrating Radar data processed and interpreted to different stages: a) stacked, b)migrated, c) velocity corrected and interpreted. Interpreted sections d)stacked, e)migrated, f) velocity corrected. Grey and white lines identify water bottom and in-filled scour, respectively Webb, et al. 2000)