Sonic Echo(SE)/Impulse Response (IR)
Sonic Echo/Impulse Response (SE/IR) tests are performed to evaluate the integrity and determine the length of deep foundations. These methods can be used to detect defects, soil inclusions and pile necking, diameter increases (bulbing) as well as estimate approximate pile lengths.
SE/IR tests are commonly performed on concrete drilled shafts and driven piles (concrete or timber) or auger-cast piles. These tests can also be performed on shallow wall structures such as an abutment or a wall pier of a bridge, provided the top of the wall is accessible.
Basic Concepts: These tests are often incorrectly described as being different data analysis procedures for data acquired by the same method i.e., that the Sonic Echo method requires only a measurement of the travel time of seismic waves (time domain) generated by a hammer impact, and the Impulse Response method uses spectral analysis (frequency domain) of the time domain data for interpretation. Although this procedure does provide some limited information, the true Impulse Response method requires measurement of the force of the hammer impact. In addition, the motion sensor in typical SE systems is an accelerometer, whereas in the IR system, is it a geophone velocity transducer.
Both methods are sometimes referred to as Pile Integrity Test methods (PIT). Further confusion sometimes occurs because the Sonic Echo method is also known as Echo, Seismic, Sonic, Impulse Echo, and Pulse Echo. Other names for the Impulse Response method include Sonic Mobility, Transient Dynamic Response, Impulse Response Spectrum, Impedance, Shock, and Transient Response.
Both the SE and the IR tests record the reflection of compressional waves (also called P waves by geophysicists) from either the bottom of the foundation element being tested, or from changes in impedance caused by a crack, soil inclusion, or change in diameter. The wave is generated by striking the top of the foundation with an impulse hammer. The wave propagates down through the foundation until it encounters a change in acoustic impedance, which reflects some or all of the wave energy back up to the top of the foundation, where it is detected by a motion transducer, or receiver. For the IR test, the hammer is instrumented with a transducer to also measure the force of the impact.
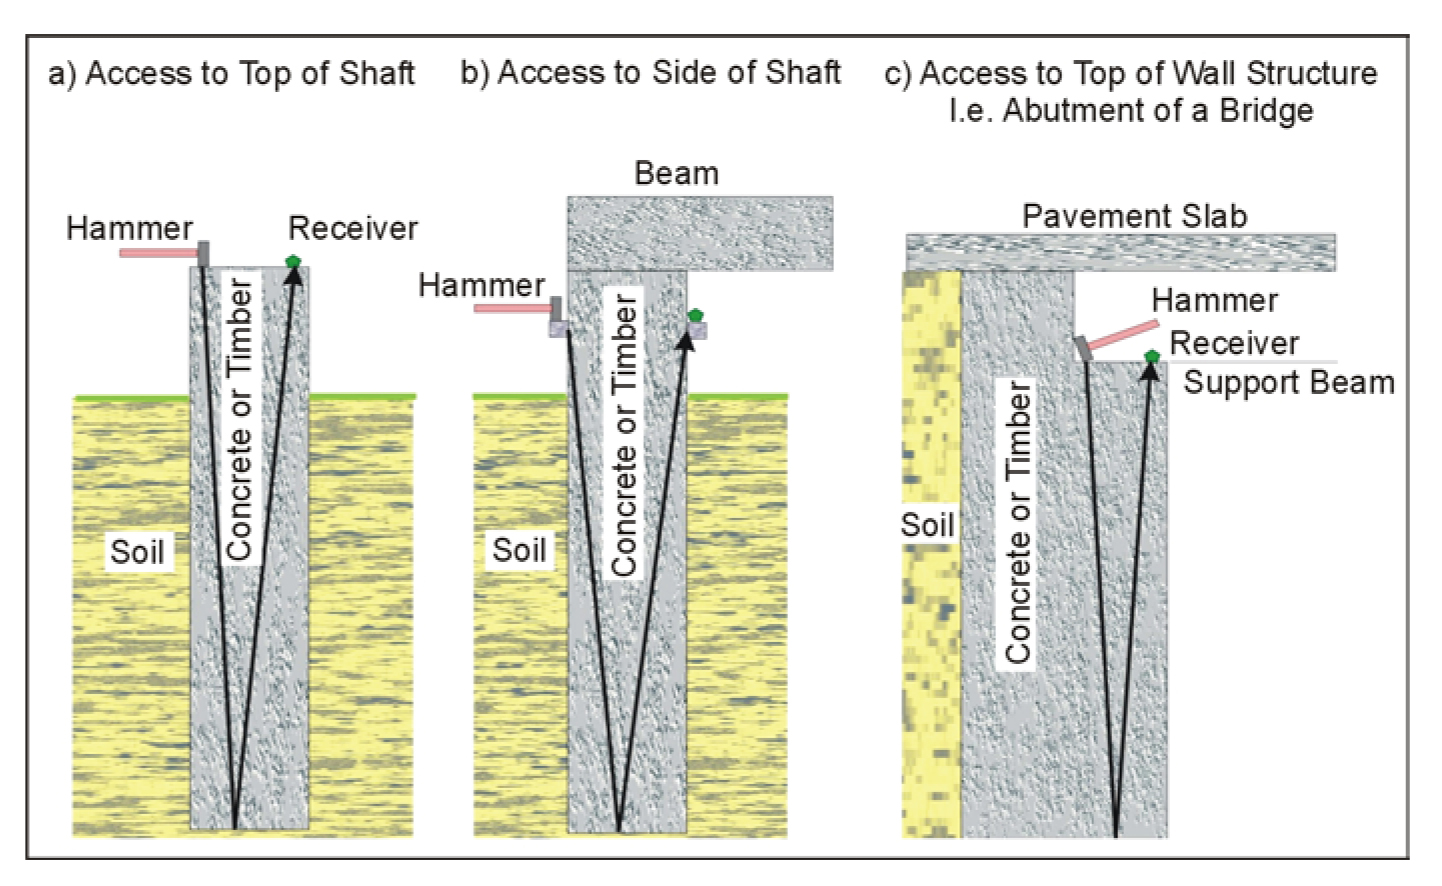
Source and receiver locations for a Sonic Echo/Impulse Response test for three shaft geometric configurations.
In both (SE/IR) tests, the reflection of compressional waves (also called P waves by geophysicists) from the bottom of the tested structural element or from a discontinuity such as a crack or a soil intrusion is measured. The generated wave from an impulse hammer travels down a shaft or a pile until a change in acoustic impedance (depends on velocity, density, and changes in diameter) is encountered where the wave reflects back and is recorded by a receiver placed next to the impact point.
Data Acquisition: For drilled shafts and piles, the best results from SE/IR tests are obtained if the top of the drilled shaft or the pile is exposed for receiver attachment and hammer hitting (see figure 1a). If the top is not exposed, then the SE/IR tests are performed on the side. This requires at least the upper 30 to 60 cm of the shaft to be exposed (see figure 1b). For wall-like shallow structures, the top of an abutment or a pier should be exposed for SE/IR testing (see figure 1c). In these cases where the superstructure is in place, the SE/IR data become more difficult to interpret because of the many reflecting boundaries, and two or more receivers should be used to track reflections (please refer to the Ultraseismic Method).
In an SE/IR test, a hammer strikes the foundation top, and a receiver monitors the response of the foundation. A digital signal analyzer records the hammer input and the receiver output. Sonic Echo (SE) tests are typically performed with different frequency filtering to optimize reflections coming from the bottom of the foundation and to reduce the effect of surface waves or reflections from a discontinuity at a shallow depth where the frequencies associated with these two conditions are high. In an Impulse Response (IR) test, a digital analyzer automatically calculates the transfer and coherence functions after transforming the time records of the hammer force sensor and the receiver to the frequency domain.
Data Processing: To aid in interpreting SE/IR data, certain processing techniques can be applied to enhance weak echoes. SE signals, which are measurements of acceleration, are commonly integrated to produce velocity and exponentially amplified to enhance weak reflections and to compensate for the damping of energy. For cases where echoes are not easily identified in the data, other processing, such as the Cepstrum technique, is used. In this technique, an autocorrelation function is calculated to help better determine the time separation between two echoes. In simple cases, the SE data can be used to obtain an image of the shaft through a process called impedance imaging.
For best results, it is important to know the P wave velocity through the concrete being tested. It is not safe to assume the P-wave velocity is known from other empirical data. The P-wave velocity is a function of concrete density and elastic modulus. Therefore, velocities can vary depending on the aggregate used, age of the structure, and state of weathering, Alkali Aggregate Reaction (AAR) or other degradation. It is easy to measure local velocity if two sides of the structure are available or if a sufficient length of the body is available for access. A source placed a measured distance from a receiver can be used to get a first arrival signal to compute the P-wave velocity.
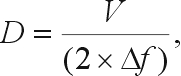
Data Interpretation: Sonic Echo data are used to determine the depth of the foundation based on the time separation between the hammer impact and the first reflection events or between any two consecutive reflection events (Δt) according to the following equation:
 (1)
(1)where D is the reflector depth, and V is the velocity of compressional waves. A reflector can be the bottom of the foundation or any discontinuity along the embedded part of the foundation. The Sonic Echo data can also be used to determine the existence of a bulb or a neck in a shaft or the end conditions of the shaft based on the polarity of the reflection events. Figure 2 illustrates the data from a Sonic Echo survey along with the depth calculation computed between the second and third echoes. The multiple echoes are all interpreted as coming from the same reflector since the time separations of the echoes are all equal. Any pair can be used to calculate the two-way travel time between the source and the reflector. In this case the clearest pair of echoes were the second and third, which were used to calculate the depth using the formula above, giving a depth of 2.01 m.
The Impulse Response data are also used to determine the depth of reflectors according to the following equation:
 (2)
(2)or between zero frequency and the first peak for soft bottom conditions.
The multiple echoes from a discontinuity or bottom, as seen in the Sonic Echo method, result in increased energy at the frequency of the echo. This causes a series of harmonic peaks in the frequency spectrum. Using the frequency difference between harmonic peaks (Δf) in the formula above gives the depth of the structure. In addition, the Impulse Response data provides information about the dynamic stiffness of the foundation. This value can be used to predict foundation behavior under working loads or correlated with the results of load tests to more accurately predict foundation settlement.

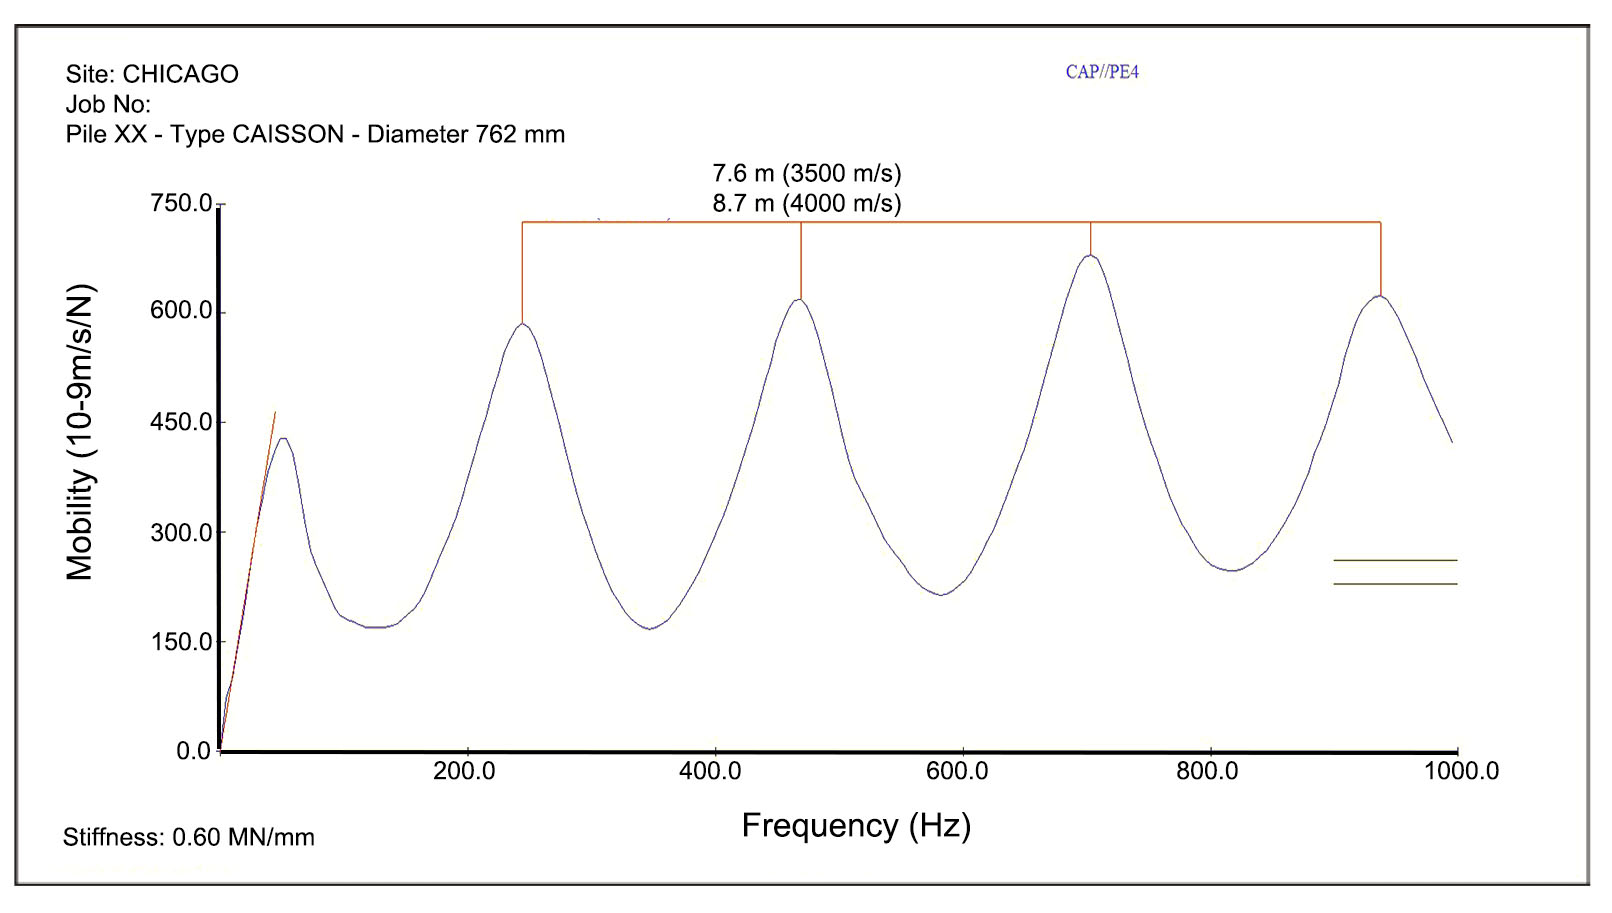
Example data for the Impulse Response method are shown in Figure 3, along with the depth calculation results showing a reflector depth of 8.7 m, assuming a P-wave velocity of 4,000 m/s.
Advantages: These are quick and economical test methods used mostly in columnar shaped foundations without access tubes. Evidence of flaws can be found and evaluated early, with minimal delays to construction.
Limitations: The SE/IR methods work best for free-standing columnar-shaped foundations, such as piles and drilled shafts, without any structure on top. Typically, SE/IR tests are performed on shafts or piles of length-to-diameter ratios of up to 30:1. Higher ratios (45:1) are possible in softer soils. The method can only detect large defects with cross-sectional area changes greater than 5%.
A toe reflection is usually not detectable if the pile is socketed in bedrock of similar stiffness (or acoustic impedance) as concrete. If the pile is embedded in very stiff soils, penetration may be limited to about 20 diameters. For the softer soils, echoes have been observed in piles with length diameter ratios of more than 55:1. This method is usually not effective on steel H-piles.
Bending Waves
This method uses flexural (bending) waves, rather than the compressional waves used in the Sonic Echo/Impulse Response method to determine integrity and unknown depth of deep foundations. It is limited to applications on rod-like deep foundations such as timber piles, concrete piles, and drilled shafts that extend above the ground or water surface.
The Bending wave method has been used experimentally on timber piles, but will also work on other, more slender members. The method has been used on timber piles up to 18.3 m in length. The key feature of this method is that only a horizontal blow is required, which is easy to apply to the side of a substructure.
Basic Concept: This method uses the propagation of flexural or bending waves in piles that are highly dispersive in nature. The bending wave velocity decreases with increasing wavelength, with most of the velocity decrease occurring at wavelengths that are longer than the pile diameter. These longer waves propagate as flexural or bending wave energy.
Correspondingly, as wavelengths become shorter than the diameter of a pile, the bending wave velocity limit is approximately that of the surface (Rayleigh) wave velocity, and this wave energy propagates as surface waves. Compressive waves are also dispersive in piles, but in a different way that, in practice, results in a velocity decrease only when a deep foundation has a low length-to-diameter ratio of about 2:1 or less, which is uncommon for deep foundations.
The classical wave equation, often called the traditional wave solution, does not account for dispersion. It is an ideal mathematical description of the behavior of the pulse, with its solution implying that a wave will travel through a rod without affecting the shape of the rod. This is the difference with dispersive signal analysis; dispersive analysis of the wave data extracts a selected group of frequencies. These frequencies are then analyzed for the individual time required to travel to the tip of the pile and back or from their tops to the location of an area of damage such as a void, break, soil intrusion, or material deterioration.
Since the method involves striking the pile on a side and placing the receivers on the side of the pile, the method is potentially useful in cases where the top of the pile is obscured by a structure. The Sonic Echo/Impulse Response methods either require the top of the pile to be accessible or a small structure needs to be rigidly attached to the side of the structure to allow hammer blows to create compressional waves.
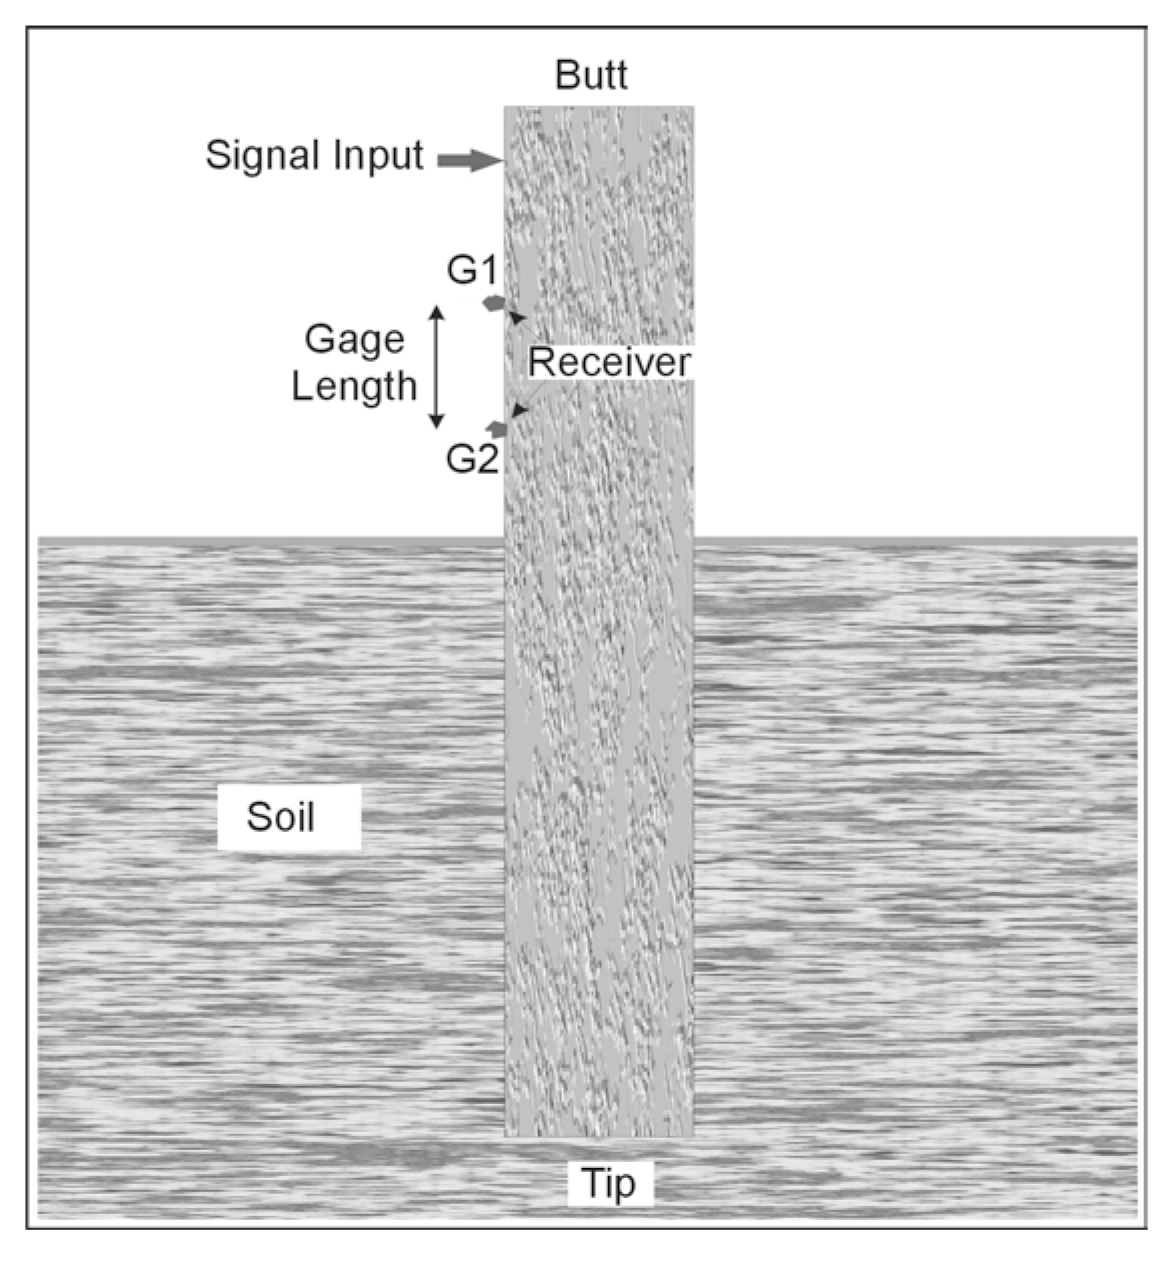
Data Acquisition: The Bending Wave method involves horizontally impacting the pile to generate flexural or bending waves that travel up and down the pile as illustrated in figure 4. The receivers are in a plane with the hammer blow on the same side of the pile. The equipment consists of a recording oscilloscope or dynamic signal analyzer, small to large hammers or other impact sources ranging from rubber to hard plastic to steel, and cushioning materials to protect and dampen the blow to the timber pile for metal-tipped hammers. Two accelerometers (G1 and G2) are used to measure the initial bending wave arrivals and subsequent reflections. The bending wave propagation is monitored by two horizontal accelerometer receivers mounted on the same side of the pile as the impact (see figure 4).
Data Processing: The Bending Wave method with the Short Kernel Method (SKM) analysis can be thought of as being the bending wave equivalent of the Sonic Echo method, which uses the faster compressional (longitudinal) waves. This method involves determining the velocity of wave travel, then identifying initial wave arrivals and subsequent reflections (echoes), and finally calculating the depths and locations of the reflection events. In the SKM method, one or more cycles are used as "Kernel Seed" in order to cross-correlate with number of seed frequencies between 500-4000 Hz.
Data Interpretation: The cross-correlation function amplifies the bending wave response at the seed frequency. Using two receivers, bending wave velocity is computed as the difference of cross-correlated peak responses. Also, upward versus downward traveling reflection events are distinguished by their travel-time moveout characteristics.
Advantages: This method provides a quick and economical test that does not require access tubes inside the foundation or boreholes outside.
Limitations: Theoretical studies have shown that for a 12-m-long, 1-m-diameter concrete shaft, depth predictions may not be able to be made for depths greater than 5 m due to the high attenuation associated with flexural waves as compared to compressional waves traveling down a rod. Stiff soil layers can result in apparent short pile lengths being predicted. Reflection events from top of the grade may be present in the data records resulting in false interpretation of the data. This method cannot be used for steel H-piles.
Ultraseismic
The Ultraseismic (US) method is performed to evaluate the integrity and determine the length of shallow and deep foundations. US tests can be performed on drilled shafts and driven or auger-cast piles. The tests can also be performed on shallow wall-shaped substructures such as an abutment or a wall pier of a bridge provided at least 1.5 to 1.8 m of the side of the structural element is exposed for testing. The method is particularly useful in testing abutments and wall piers of bridges because of the relatively large exposed areas available for testing.
The Ultraseismic tests can be performed on concrete, masonry, stone, and wood foundations. Steel pile foundations can also be tested, but damping of the energy in this case is much greater than that of concrete and wood due to the large surface areas and small cross-sectional areas of steel piles.
Ultraseismic method was developed by Mr. Frank Jalinoos as part of NCHRP 21-5 research program in response to the difficulty encountered in interpreting the Sonic Echo/Impulse Response and Bending wave methods from complex structures (such as a bridge) where many reflecting boundaries are present. This method is an adaptation of multi-channel seismic reflection method to bounded engineered structures.
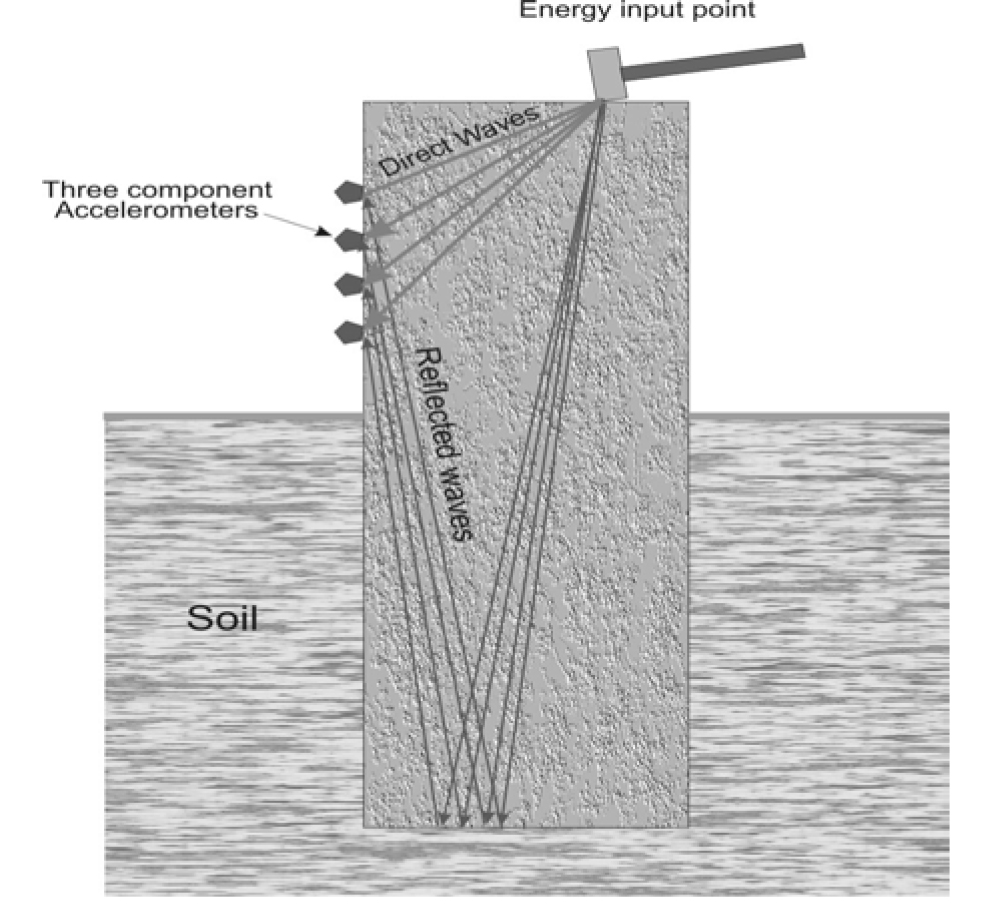
Basic Concept: The Ultraseismic method uses multi-channel, three-component (vertical and two perpendicular horizontal receivers, i.e., triaxial receiver) recording acoustic data followed by computer processing techniques adapted from seismic exploration methods. Seismograph records are typically collected by using impulse hammers as the source, and accelerometers as receivers that are mounted on the surface or side of the accessible bridge substructure at intervals of 30 cm or less. The bridge substructure element is used as the medium for transmission of the seismic energy. Four wave modes of longitudinal (compressional) and torsional (shear) body waves as well as flexural (bending) and Rayleigh surface waves can be recorded by this method. Seismic processing can greatly enhance data quality by identifying and clarifying reflection events that are from the foundation bottom and minimizing the effects of undesired wave reflections from the foundation top and attached beams. For concrete bridge elements, useful wave frequencies up to 4 to 5 kHz are commonly recorded.
This method can be used in two modes: Ultraseismic Vertical Profiling (VP), presented below, and Horizontal Profiling (HP).
Data Acquisition: The Vertical Profiling test geometry is presented in figure 5 and shows the accelerometers and impact point. The impact point can be located either at the top or the bottom of the receiver line. Vertical impacts to the substructure are comparatively rich in compressional wave energy, although more flexural/Rayleigh (surface) wave energy is generated. Horizontal impacts are rich in flexural wave energy when the impacts generate wavelengths that are longer than the thickness of the substructure element. Impacts that generate wavelengths shorter than the thickness will be rich in Rayleigh wave energy. The VP accelerometer array is useful for differentiating downgoing events from the upgoing events based on their characteristic time moveout, and accurately measure their velocity. A VP accelerometer array is also used to tie reflection events from the bottom to a corresponding horizon in an HP section. For a medium with a bounded geometry, such as a bridge column, four types of stress waves are generated that include longitudinal (compressional), torsional (shear), surface (Rayleigh), and flexural (bending) waves. In longitudinal vibration, each element of the column extends and contracts along the direction of wave motion that is along the column axis. In torsional vibration, each transverse section of the column remains in its own plane and rotates about its center. Finally, in flexural vibration, the axis of the column moves laterally in a direction perpendicular to the axis of the column. Each wave type can independently provide information about the depth of the foundation or the presence of significant flaws within the bridge substructure. However, practically, longitudinal (P-wave, compressional) and flexural (bending) waves are much easier to generate on bridge substructures than torsional waves. Consequently, compressional and flexural wave energy were generated by orienting impacts to substructures vertically and horizontally, respectively.
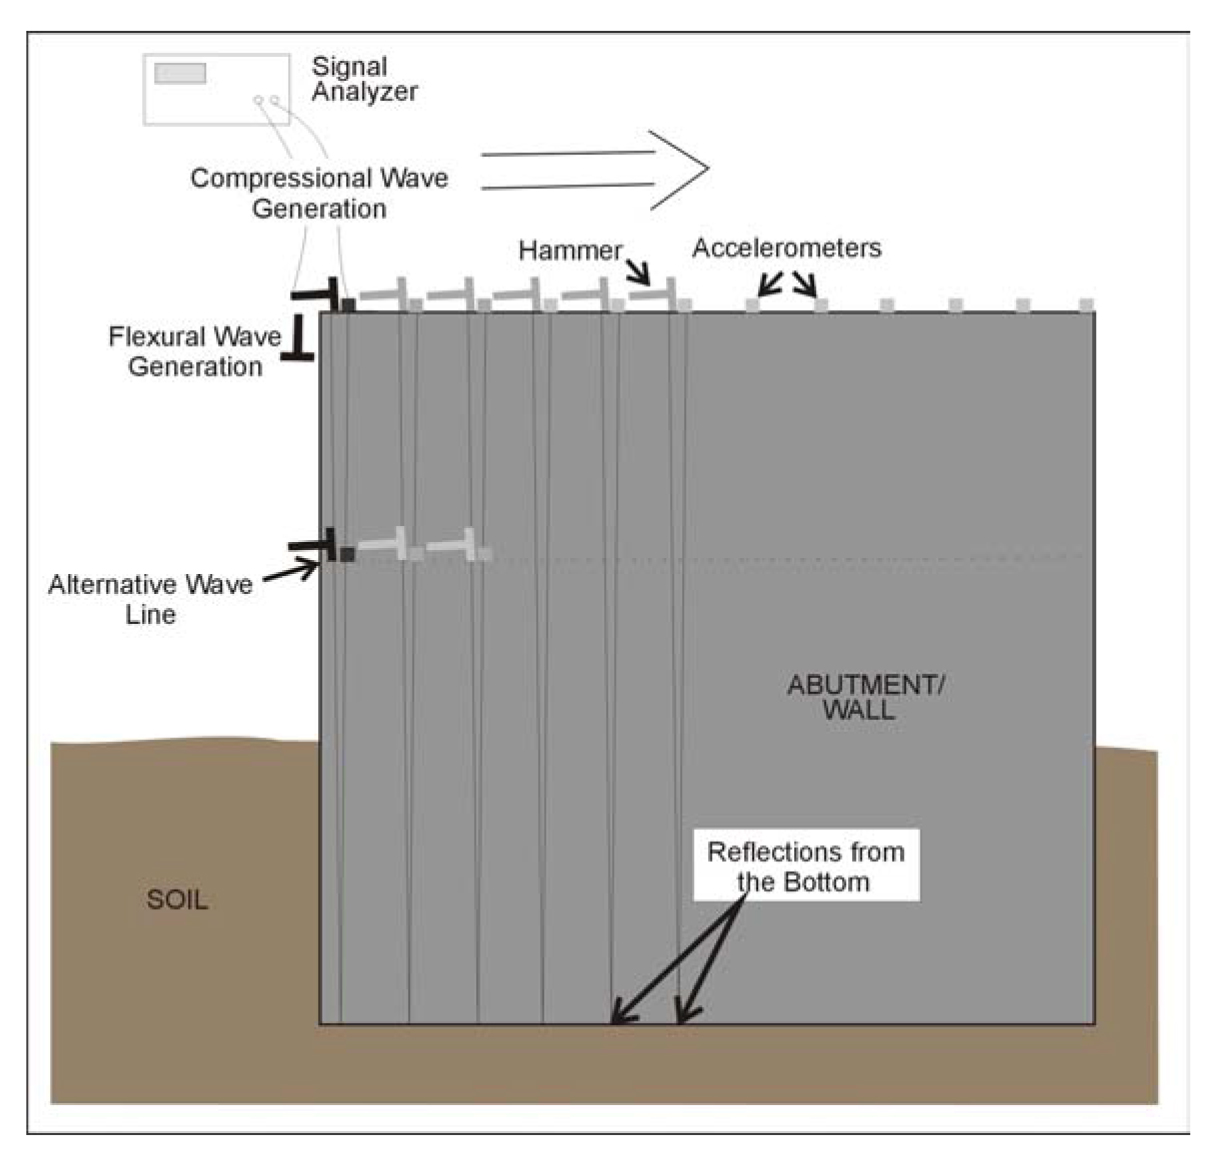
The Ultraseismic Horizontal Profiling Method (HP), presented in figure 6, was developed for potential use on massive abutment and wall substructure elements and dam like structures, which typically have greater widths of top or side surfaces. This permits access to a line of receivers to be placed at a common elevation. The HP method uses the same basic equipment as the VP test, but since the receivers are at the same elevation, reflection events from footing bottoms should have the same arrival time in the seismic records.
Data Processing: The recorded receiver outputs from the many receiver locations are stacked together much like stacking of reflection seismic geophysical data. The stacking of many traces improves the signal-to-noise ratio and provides better tracking of the reflected waves. In addition, the slope of coherent events in the stacked records determines the velocity of the direct and reflected waves to be used in the depth calculation. Confidence in the interpretation of the US data is higher than in the SE/IR and SKM test data because of the use of many receiver locations.
In addition to stacking the data from US tests, other geophysical data processing techniques can be used. Applications of digital filters, Automatic Gain Control (AGC), source deconvolution, and migration techniques can be applied to the data to enhance weak echoes. Also, separation of downgoing events from upgoing events enhances the weak echoes coming from the bottom of the foundation or any discontinuity along the buried length of the foundation.
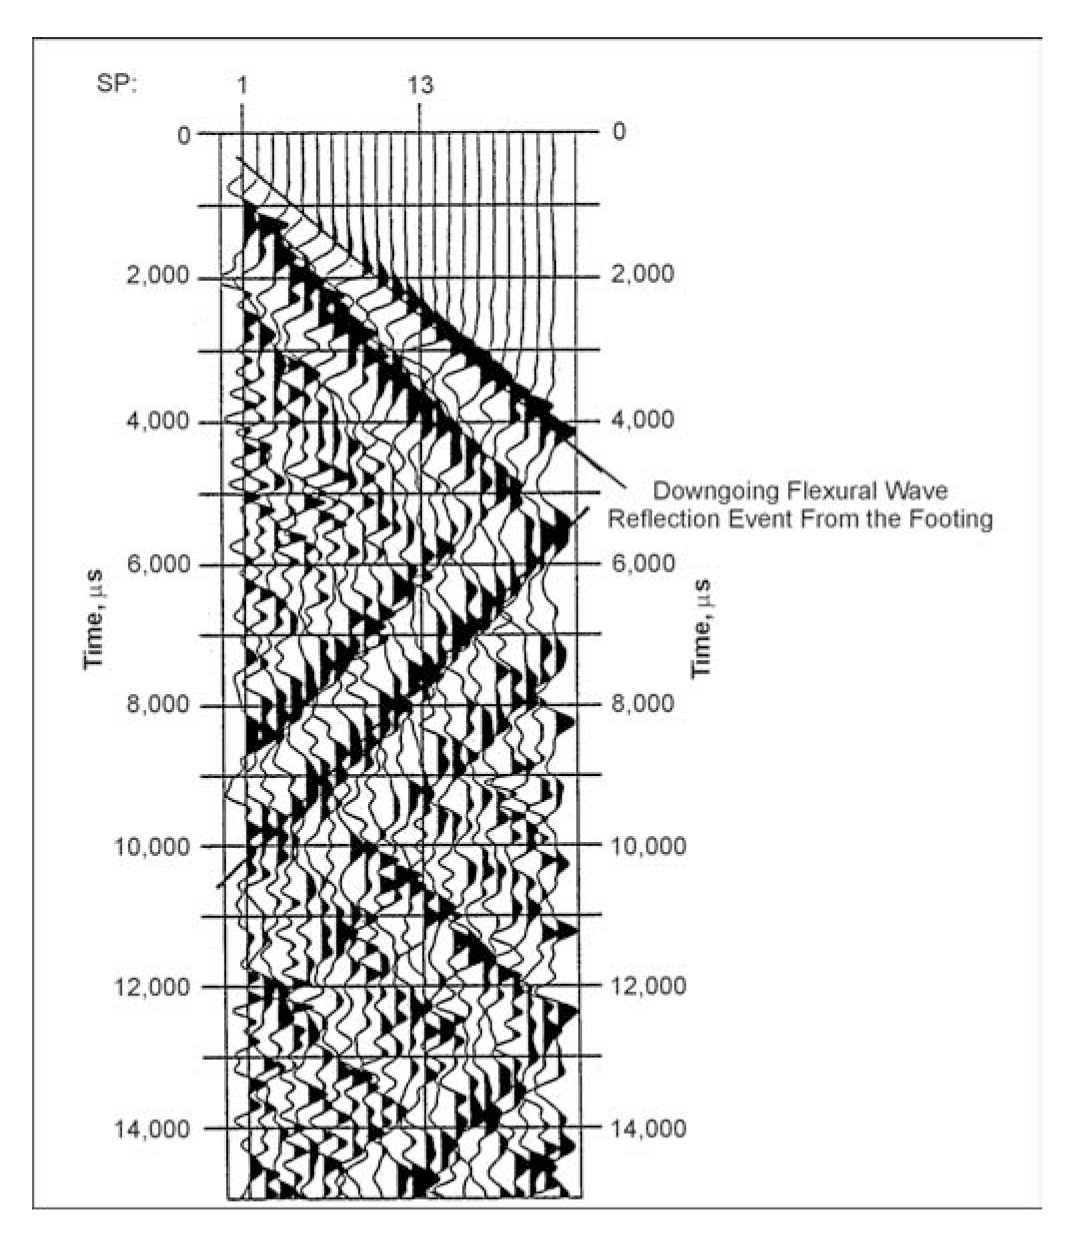
Data Interpretation: An example US-Vertical Profiling dataset from a concrete pier foundation is shown in figure 7. In this figure, the seismic record from the horizontal impact of a 1.4-kg hammer and horizontal component accelerometer recording is shown at 4-ms sampling interval after bandpass filtering and automatic gain control (AGC) being applied. The 1.4-kg hammer was located at the top of the bridge pier and the receiver survey line was laid out below the source using 0.3 m intervals. Therefore, trace 2 is located 0.3 m below the source location and trace 22 (the last trace) at 6.4 m below the source location. The downgoing flexural waves have a linear positive moveout with travel time increasing with distance and upgoing events having a negative linear moveout. For this field geometry, the depth of the foundation is easily calculated from the intersection of downgoing and upgoing events at about 9 m below the top of the pier beam.
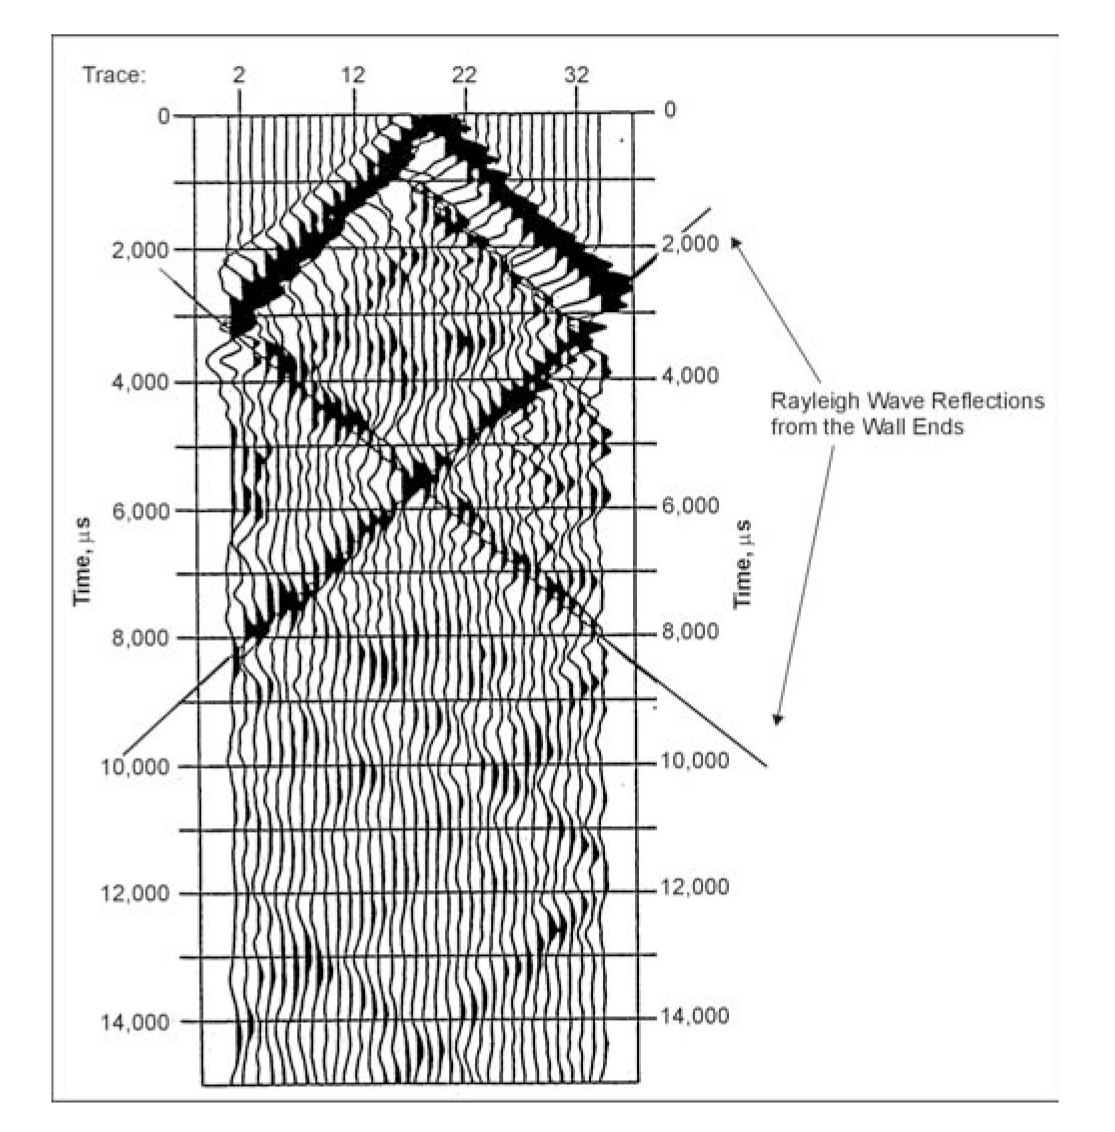
An example US-Horizontal Profiling dataset from a pier wall structure is shown in figure 8. In this figure, the seismic "shot record" from the vertical impact of a 1.4-kg hammer and vertical component accelerometer recording is indicated at 4-ms sampling interval after bandpass filtering and automatic gain control (AGC) gain being applied. The 1.4-kg hammer was located at the center of the wall and the receiver survey line was laid out at 0.3 m intervals across the top of the wall along its centerline. Weak bottom reflection events from the wall bottom are present and processing techniques adapted from seismic data processing method can be used to image bottom reflections.
The data records also clearly indicate Rayleigh surface wave events that are reverberating from both ends of the wall in a X-pattern. The Spectral Analysis of Surface Waves (SASW) method has been used to determine unknown depths of foundations in bridge abutments. With multi-receiver US-Horizontal profiling recording, the more generalized Multichannel Analysis of Surface Waves (MASW) method can be used in this application in assessing integrity and depth.
Advantages: This method can be used to obtain two-dimensional reflection images from complex structures, such as bridges, buildings, and dams. It uses well-proven processing techniques developed in the seismic exploration method. Multiple-channel recording allows for differentiation of bottom echoes from other complex wave modes far more reliably than single-channel Sonic/Pulse Echo or Bending wave methods. Ultraseismic tests can determine the depth of foundations with an accuracy of about 95%.
Limitations: The Ultraseismic method requires at least 1.5 to 1.8 m of the structural member to be exposed, which is not always possible. For very deep foundations, echoes from the bottom may not be obtained because of the attenuation of energy in the surrounding soil. The Ultraseismic method is not capable of determining the depths of buried piles, especially steel H-piles, beneath a buried pile cap.
Seismic Wave Reflection Survey
An application of Seismic Wave Reflection survey method, used to image the toe of a pile column, is described in Use of Geophysical Methods in Construction, edited by Soheil Nazarian and John Diehl is included herein.
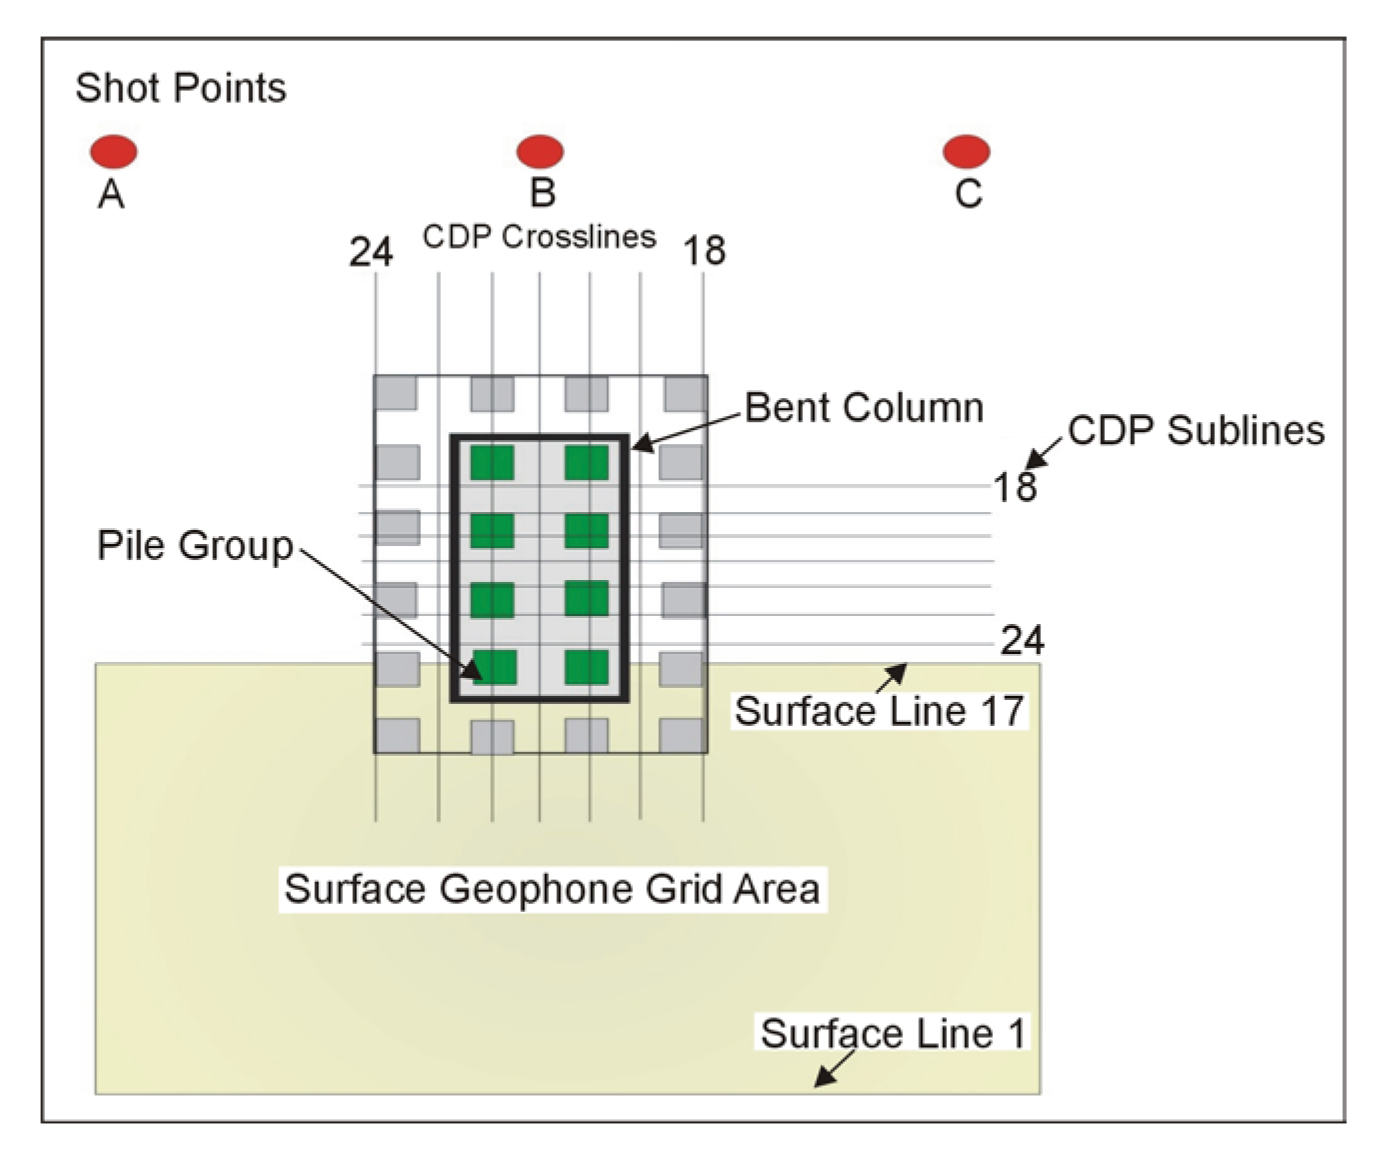
Basic Concept: In this method, the seismic survey involved setting up shot points on one side of the pier and two horizontal component geophones on the other side of the pier. The toe of the pier will diffract seismic waves passing under it. The depth of the pier can be found from the position of the diffractions on the seismic records.
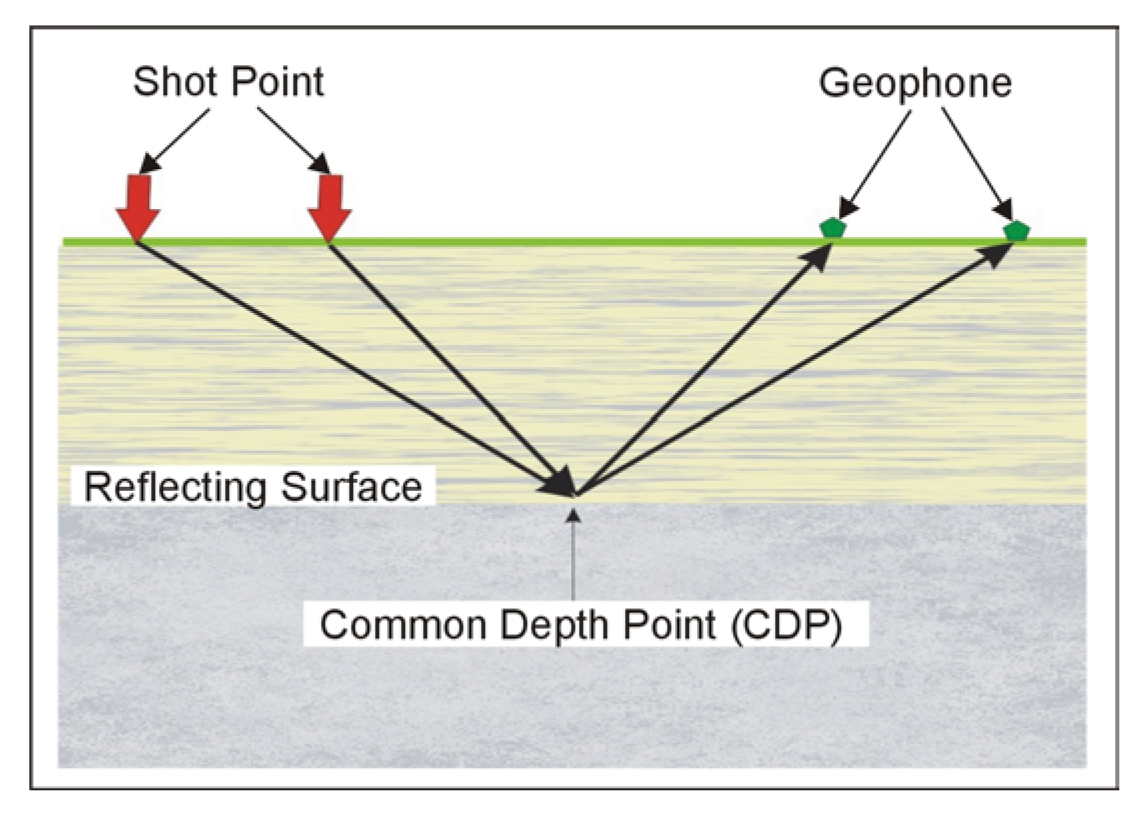
Data Acquisition: Figure 9 shows the layout of the seismic lines and the pier location.Reflection seismic data are usually considered to image a point midway between the shot and the receiver. This point is called the Common Depth Point (CDP) (as illustrated in figure 10). Seismic traces that occur at a CDP are usually summed together to form a single trace. For each shot, the geophones record the ground surface motion in two orthogonal directions. Repeating a number of hammer blows at the same location allows the data recorded at the geophones to be stacked, thus improving the signal-to-noise ratio.
Data Processing: If a diffracting surface exists below the ground surface, its geophysical signature along any subline will appear as a hyperbola. The seismic data were processed using standard seismic processing procedures, including migration to collapse the diffraction patterns.
Data Interpretation: The data are interpreted by observing the time on the processed seismic record at which the reflections from the toe of the pile occur. Using this time along with the measured rock/soil velocity allows the depth of the pile to be calculated.
Advantages and Limitations: Because seismic pulses have a finite wavelength and hence bandwidth, the pulses "see" the bottoms of the piles as a zone that is a fraction of the length of the waves. It would take very high-frequency energy to see the precise locations of the bottoms of the piles. Having a finite wavelength produces some uncertainty about the depth of the pile, with shorter wavelengths providing less uncertainty. Generally, for field conditions, a depth resolution to about one-half of one wavelength can be expected. If the peak frequency is about 550 Hz, and the velocity of the waves is about 500 m/sec, then the wavelength is about 0.9 m. Thus, the resolution will be about 0.45 m.
Transient Forced Vibration Survey
The transient forced vibration survey method is used to image the toe of a pile column. This method is described in Use of Geophysical Methods in Construction, edited by Soheil Nazarian and John Diehl is included herein.
Data Acquisition: For this survey, geophones are mounted on the vertical column that extends above the ground surface. A hammer is used to strike the column in a horizontal direction, producing shear waves; the shear wave data are recorded by geophones. This process is repeated by impacting the opposite side of the column. This allows the compressional wave component of the signal to be removed from the total signal, thereby isolating just the shear wave signal.
Data Processing: For the survey described in the above-referenced book, autocorrelation, automatic gain control, and filtering were used to process the data. Upgoing and downgoing waves are separated using velocity filters. Autocorrelation functions were then developed between the downgoing waves, the upgoing waves, and the summation of upgoing and downgoing waves after gain equalization to achieve equal power in both sets of waves.
Data Interpretation: The data are interpreted using the autocorrelation functions for upgoing, downgoing, and summed waves. In the example, survey peaks in these functions are observed, corresponding to the periodicity of the column and the drilled shaft. Using velocity information, the distances from the source to these reflection points can be obtained. These distances correlate well with the known distances.
Advantages and Limitations: It is not possible to interpret the data using simple reflection times. The autocorrelation function is needed to identify major periodicities. The method sees the average of pile depths with multiple piers and cannot resolve the number of individual piles or their individual lengths