Electrical conductivity of earth materials is influenced by the metal content (sulfides) in the rock, porosity, clay content, permeability, and degree of pore saturation.
Metal Content
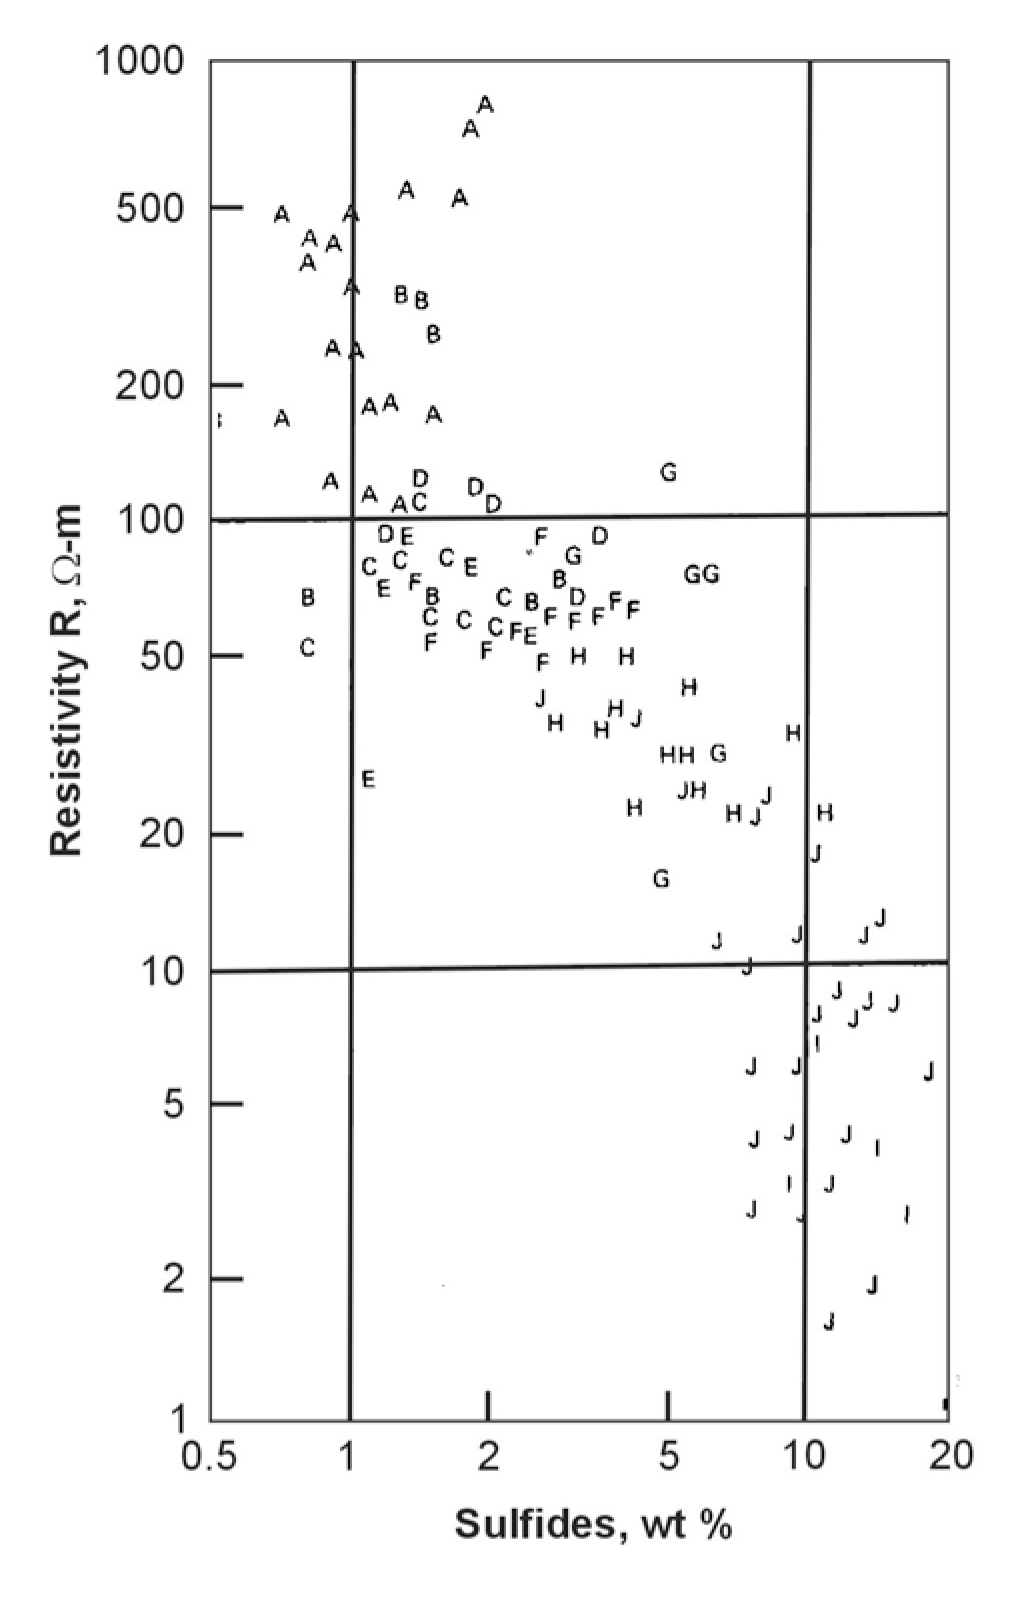
All metal objects of interest in contaminated site assessments have a very large conductivity contrast with their surroundings and can usually be readily detected with electrical and electromagnetic methods. Quantitative estimates of the metal content are not easily obtained. Nelson and Van Voorhis (1982) show the resistivities of a large number of sulfide-bearing rocks (from 0.5 to 15 weight percent). A version of their figure is reproduced from Hearst and Nelson (1985) in figure 225. As Hearst and Nelson point out, below 2% there is not much correlation, whereas between 2% and 10%, there is a steady decrease in electrical resistivity The slope of resistivity vs. percent sulfides decreases ( i.e. conductivity increases ) noticeably beyond ten percent sulfides. This decrease quickens beyond 10%, suggesting that small veins are forming exceptionally conductive pathways. Note that IP effects are much more pronounced than resistivity anomalies at the low metal content.
Porosity
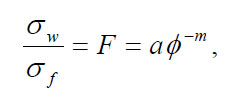
In the absence of metals, which conduct electronically, formation conductivity is related to the volume and conductivity of the water in earth materials. The groundwater conducts through its ions, and its conductivity, therefore, depends strongly on the total dissolved solids. Within a porous, clay-free medium whose matrix is non-conducting, a relationship known as Archie's Law is widely used and reasonably valid:
 (16)
(16)
where

As Hearst and Nelson point out, it is amazing that the conductivity of so many geological formations is well represented by this simple function of porosity. It holds true even to the very low porosities found in crystalline rocks.
For a simple three-component system of air, water, and matrix, the relation
 (17)
(17)
where

Therefore, if the formation factor and groundwater conductivities of a saturated formation can be measured (say by geophysics and sampling, respectively), the porosity can be approximately estimated. If F is known, then S can be estimated in a partially saturated medium.
Clay Content
Clays and shales are hydrated minerals with high porosities and low permeabilities. The minerals themselves may not be very conductive, but their surface charge causes an excess of cations in the pore fluid immediately adjacent to the clay surfaces. The result is high conductivity near the clay surfaces, which can dominate the overall conductance if the pore water conductivity is low. A commonly quoted relationship (Waxman and Smits, 1968) is:
 (18)
(18)
where σχ = conductivity of the exchangeable cations. σχ can be estimated from its cation exchange capacity. However, there are several problems in applying this apparently simple equation.

Figure 225. Electrical resistivity of rocks with various wt % of sulfide. Samples each average over several cubic meters.
Permeability
Archie's relationship notwithstanding, a rock with a non-conducting matrix must be permeable as well as porous to conduct electricity. There is a clear symmetry between the laws of Darcy and Ohm, which predict electrical current and fluid flow, respectively.
Darcy's Law:
 (19)
(19)
Ohm's Law:
 (20)
(20)
where

Nonetheless, relationships between electrical conductivity and permeability are tricky and site specific.
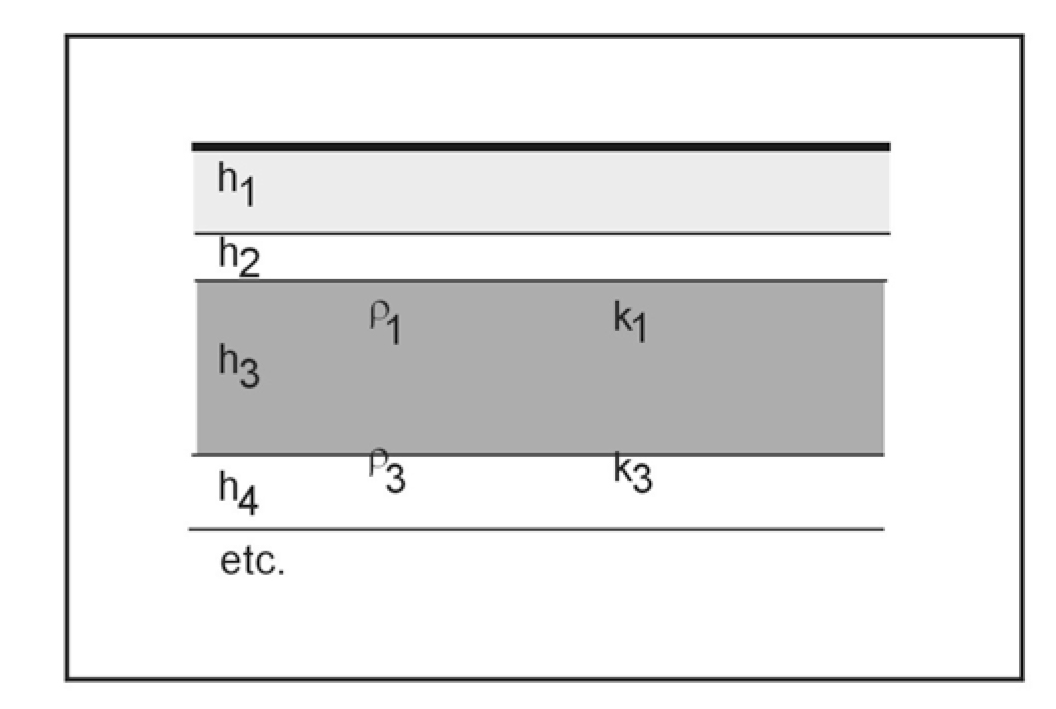
These relationships are sought at both the material (sample) level and on aquifer scales. An excellent summary is given by Mazac, et al. (1985). At the aquifer level, the resistivity, transverse resistance, and horizontal conductance, as measured by surface resistivity and EM soundings or well logs, are compared to average hydraulic conductivity, transmissivity, and leakance. These parameters are illustrated in figure 226 and table 12.
Table 12. Comparison of electric and hydraulic properties.

Depending on the resistivity structure, surface resistivity soundings can often estimate either T or S for an aquifer sequence, but not H or ρt or ρl independently. If H = Σhi can be estimated from other data, then the average resistivities can be obtained.

Figure 226. A layered aquifer model.
Also, it is useful to be able to correct for known changes in the water quality between sites since these will affect ρ but not K. At the material level, both direct and inverse relationships between resistivity and hydraulic conductivity are quite possible.

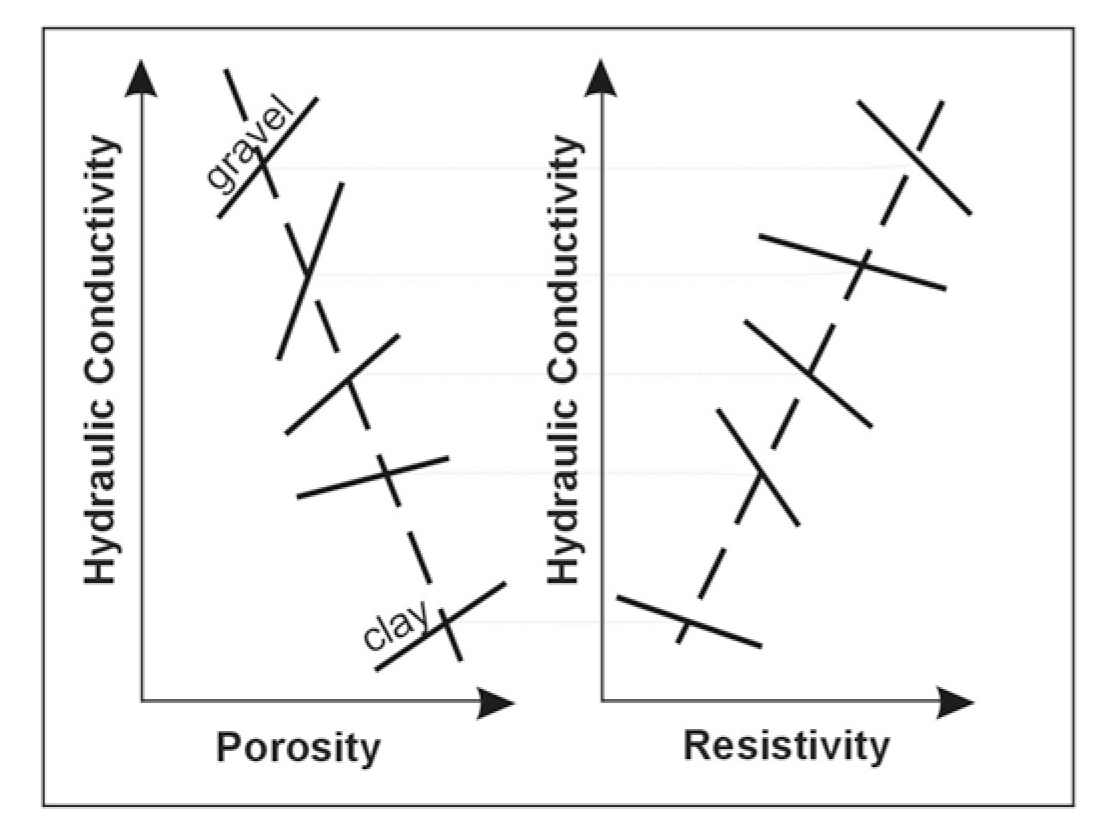
Figure 227. Schematic relationship between hydraulic conductivity, porosity and resistivity (Mazac et al., 1985).
For a clean aquifer, where Archie's Law predicts an inverse relationship between resistivity and (effective) porosity, effective porosity determines hydraulic conductivity, and an inverse relationship with hydraulic conductivity can be expected.
For different materials, however, hydraulic conductivity increases and porosity decreases with grain size, leading to a direct relationship between ρ and k. In situations where clay content dominates the resistivity of a material, again a direct relationship between ρ and k can be expected (as in the example above). Mazac, et al., (1985) shows a generic trend between different materials (clay to gravel) with an inverse k vs. 𝝓 and a direct ρ vs. k relationship. Superimposed, for any given material, they show opposite trends. This is shown schematically in figure 228.
Skin Depth
In electromagnetic methods, the electrical conductivity of the earth plays a pivotal role in the
penetration that can be obtained. Conductivity removes (attenuates) energy from the EM wave through
the work done by moving ge. Higher frequency EM waves lose energy more quickly than low frequency
waves because, conceptually at least, they move more ge in a given time. The depth at which a plane
electromagnetic wave will be attenuated to  of its
surface amplitude is called the skin depth 𝛿. The usefulness of the skin depth concept is that it represents the maximum penetration of
an EM method operating at frequency f in a medium of
conductivity σ. The actual exploration depth
may well be much less than a skin depth owing to other factors, notably the geometry of the
prospecting system. Skin depth is related to conductivity as:
 (21)
(21)
where


Figure 228. Skin depth as a function of resistivity and frequency.
The second formulation assumes a free space permeability of 4π.10-7. A chart of skin depth versus frequency is shown in figure 228.