The multichannel analysis of surface waves method (MASW) is a nondestructive seismic method to evaluate pavement thickness as well as to evaluate linear elastic modulus of ground and materials under pavement. It analyzes dispersion properties of certain types of seismic surface waves (fundamental-mode Rayleigh waves) propagating horizontally along the surface of measurement directly from impact point to receivers. It gives this shear-wave velocity (Vs) (or stiffness) information in either 1-D (depth) or 2-D (depth and surface location) format in a cost-effective and time-efficient manner. The main advantage with the MASW method is to take a full account of the complicated nature of seismic waves that always contain harmful noise waves such as higher modes of surface waves, body waves, scattered waves, traffic waves, etc. These noise waves may result in a significant portion of the recorded data being dubious if not properly accounted for. The fundamental framework of the MASW method is based on the multichannel recording and analysis approach long used in seismic exploration surveys. These techniques can discriminate useful signal against all other types of noise by utilizing pattern-recognition techniques.

Figure 80. Schematic illustrating a typical Multichannel Analysis of Surface Waves survey setup. (Kansas Geological Survey)
Basic Concept: A multiple number of receivers (usually 24 or more) are deployed with even spacing along a linear survey line with receivers connected to a multichannel recording device (seismograph) (figure 80). Each channel is dedicated to recording vibrations from one receiver. One multichannel record (commonly called a shot gather) consists of a multiple number of time series (called traces) from all the receivers in an ordered manner.
Data Acquisition: Unlike other types of seismic methods (e.g., reflection or refraction), acquisition parameters for MASW surveys have quite a wide range of tolerance. This is because the multichannel processing schemes employed in the wavefield transformation method have the capability to automatically account for such otherwise adverse effects as near-field, far-field, and spatial aliasing effects. Nevertheless, two types of parameters are considered to be most important: the source offset (x1) and the receiver spacing (dx) (figure 80). The source offset (x1) needs to change in proportion to the maximum investigation depth (zmax). A rule of thumb is x1 ≈ zmax. The receiver spacing (dx) may need to be slightly dependent on the average stiffness of near-surface materials. A rule of thumb is dx ≈ 1 m. Table 7 summarizes optimum ranges of all the acquisition parameters.
Data Processing: Data processing consists of three steps (figure 81): 1) preliminary detection of surface waves, 2) constructing the dispersion image panel and extracting the signal dispersion curve, and 3) back-calculating Vs variation with depth. All these steps can be fully automated. The preliminary detection of surface waves examines recorded seismic waves in the most probable range of frequencies and phase velocities. Construction of the image panel is accomplished through a 2-D (time and space) wavefield transformation method that employs several pattern-recognition approaches. This transformation eliminates all the ambient noise from human activities as well as source-generated noise such as scattered waves from buried objects (building foundations, culverts, boulders, etc). The image panel shows the relationship between phase velocity and frequency for those waves propagated horizontally directly from the impact point to the receiver line. These waves include fundamental and higher modes of surface waves as well as direct body (compressional) waves (figure 81). The necessary dispersion curve, such as that of fundamental-mode Rayleigh waves, is then extracted from the energy accumulation pattern in this image panel (figure 81). The extracted dispersion curve is finally used as a reference to back-calculate the Vs variation with depth below the surveyed area. This back-calculation is called inversion and the process can also be automated.

Table 7. Optimum acquisition parameters — rules of thumb.

Figure 81. A 3-step processing scheme for Multichannel Analysis of Surface Waves data.
Actual data set was acquired over a desert site near Yuma, Arizona.
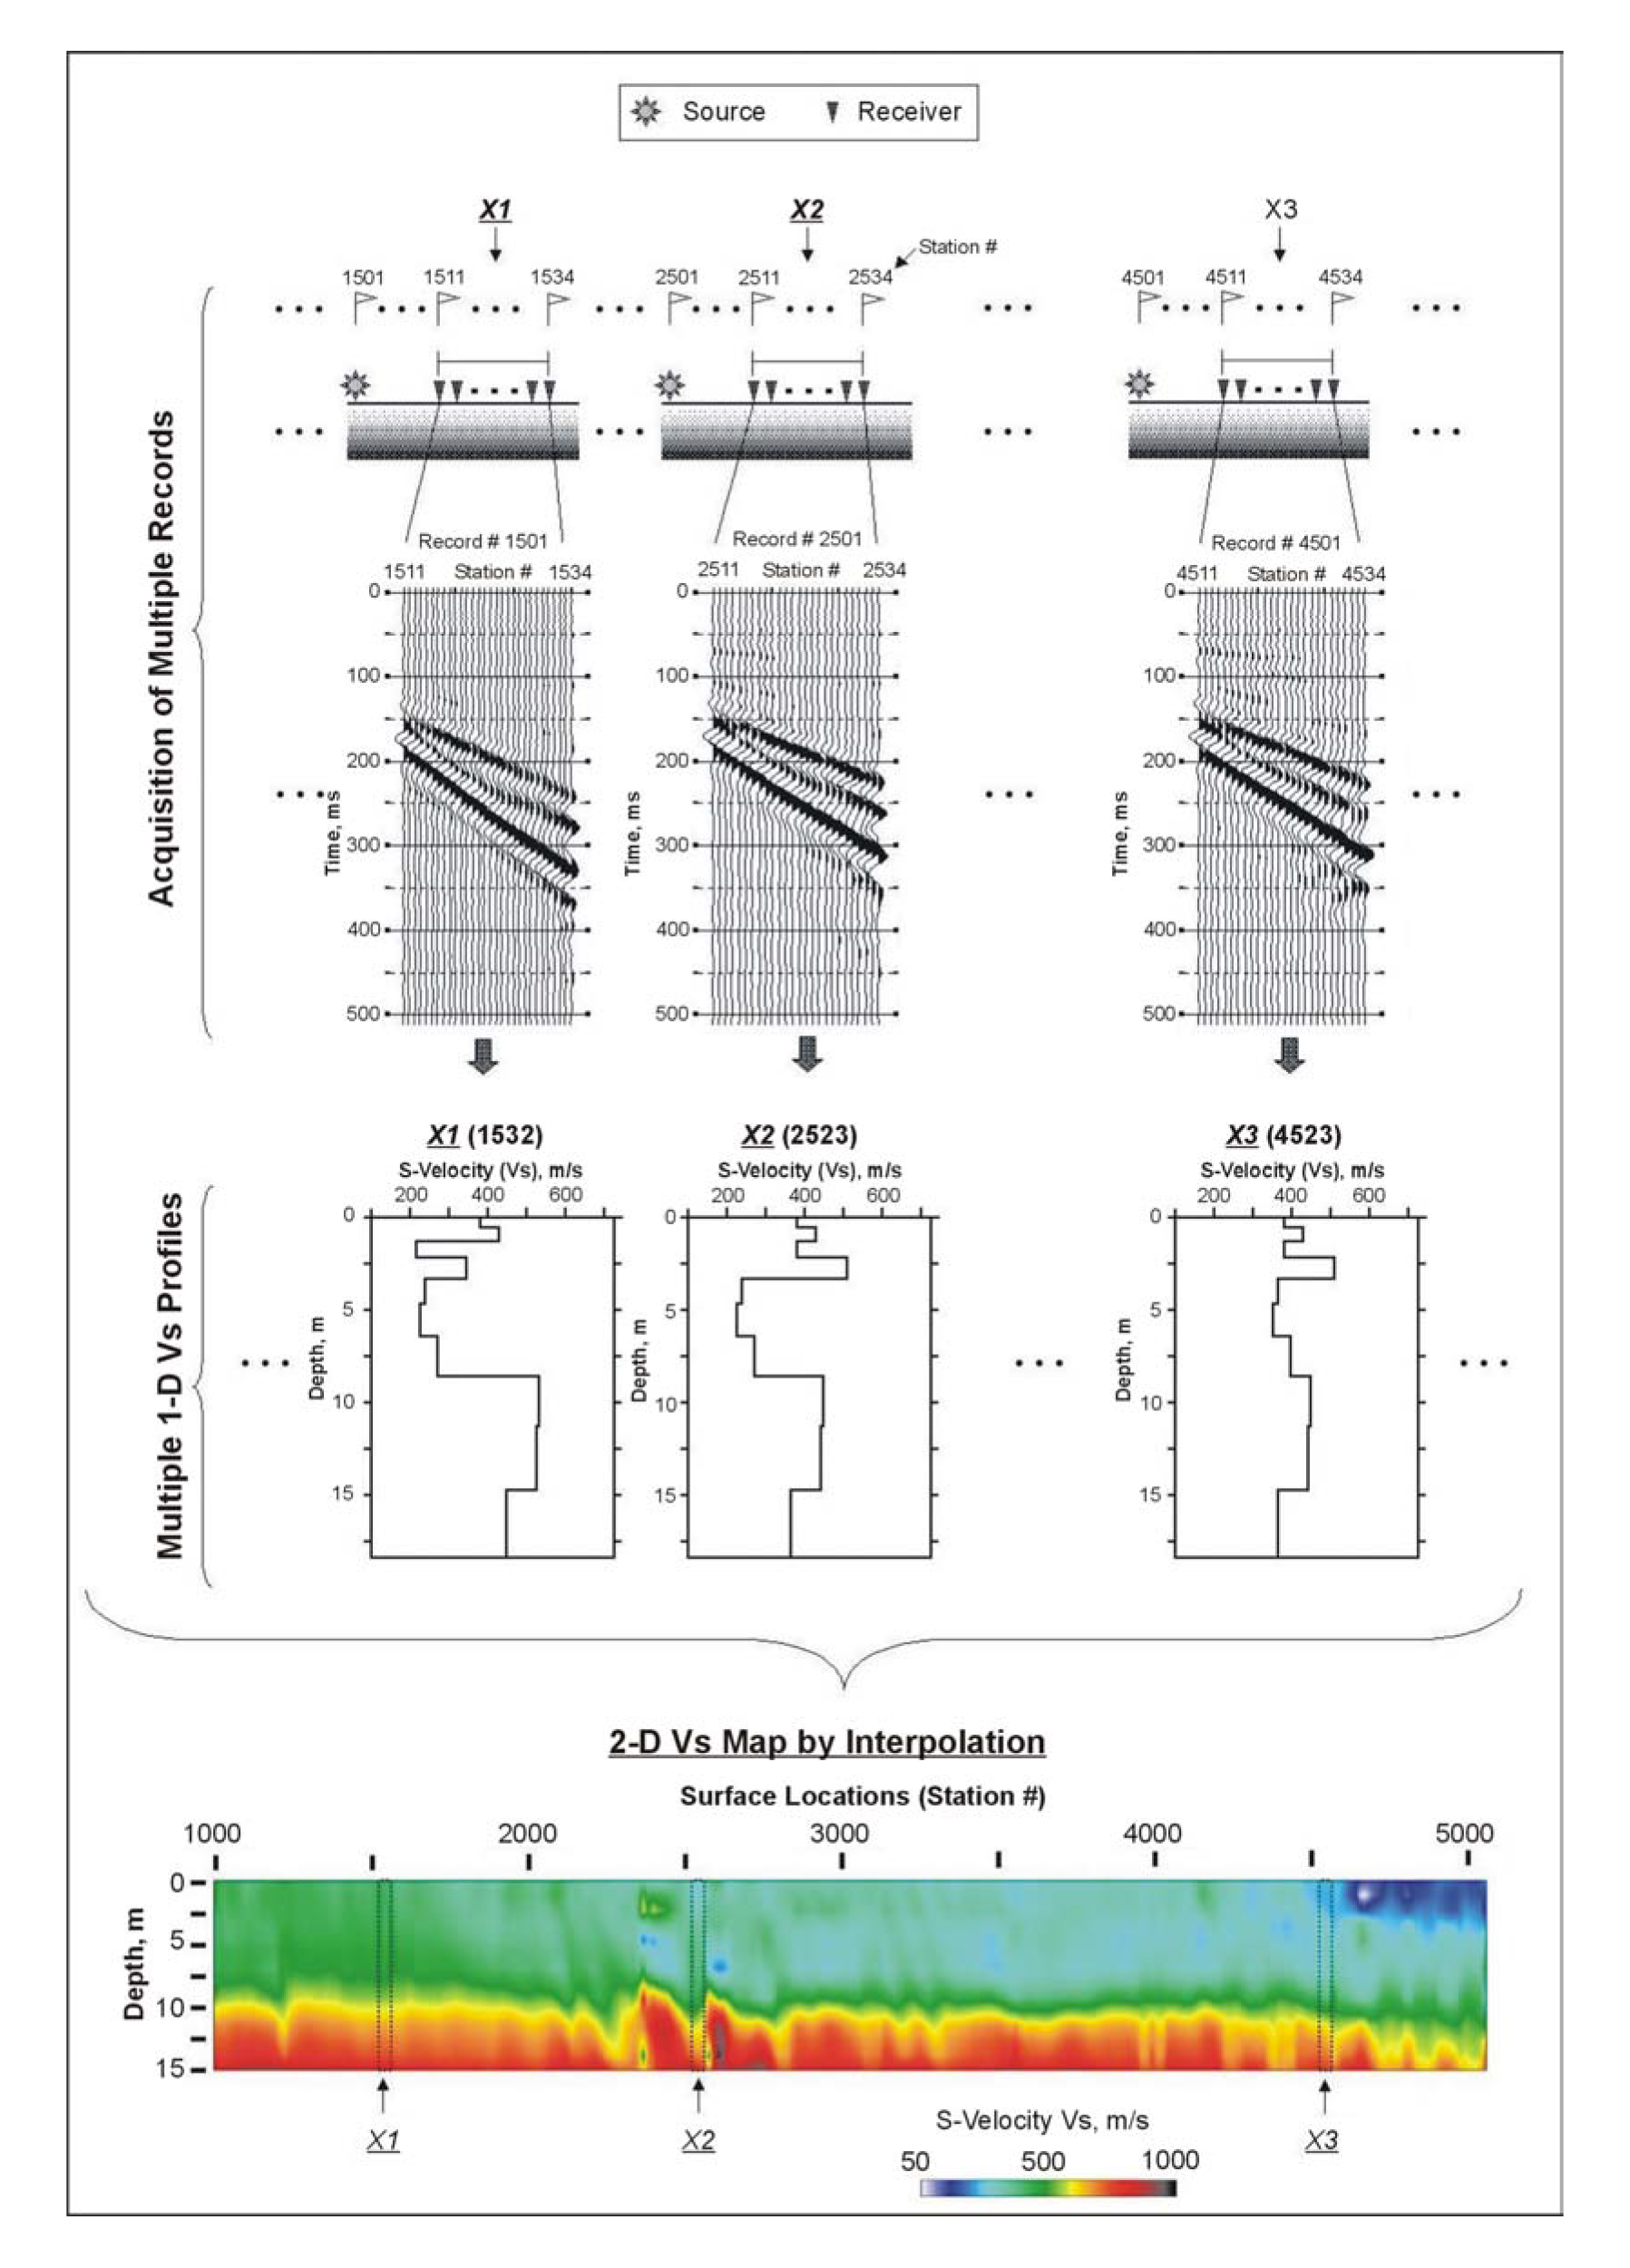
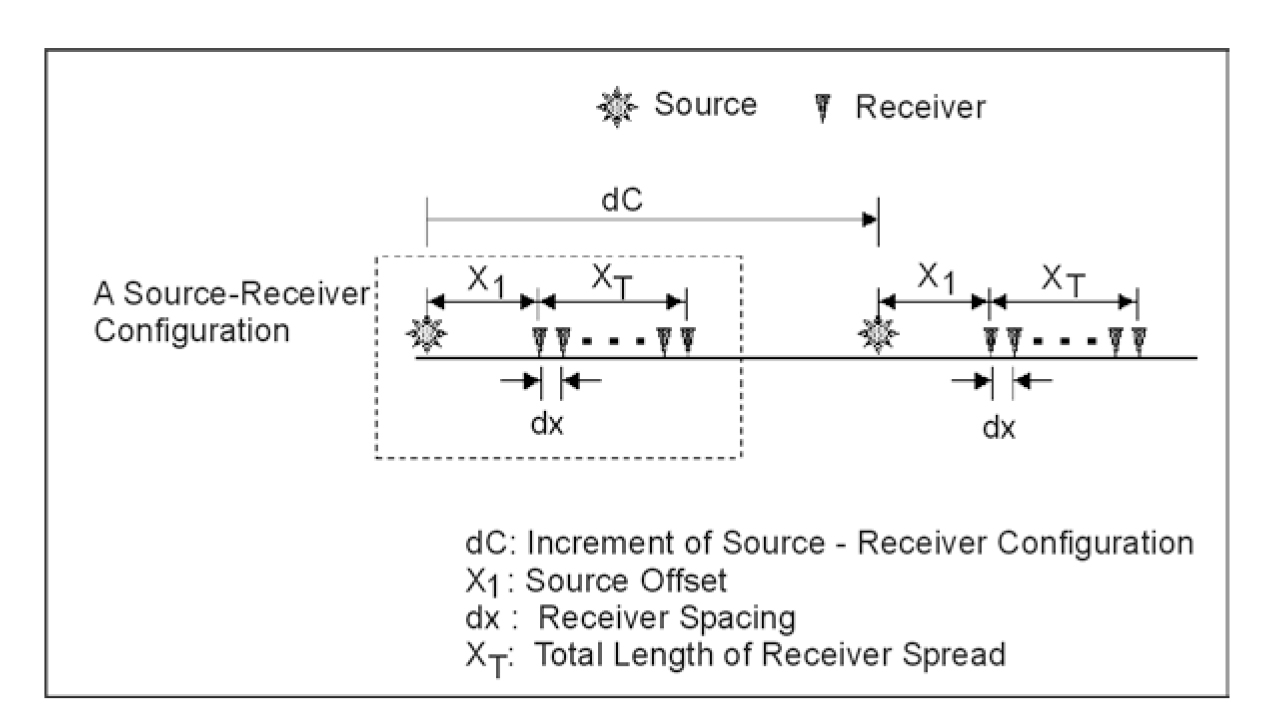
Data Interpretation: A 2-D Vs map is constructed from the acquisition of multiple records (figure 82) with a fixed source-receiver configuration and a fixed increment (dC) of the configuration (figure 83). A source-receiver configuration indicates a setup of given source offset (x1), receiver spacing (dx), and total number of channels (N) used during a survey. The increment dC depends on the degree of horizontal variation in Vs along the entire survey line. A small increment would be necessary if a high degree of horizontal variation is expected. In most cases where total receiver spread length (xT) is set in such a way that horizontal variation within xT can be ignored, an increment of half the spread would be sufficient: dC ≈ 0.5 xT. Therefore, determination of optimum xT has to be made before optimum dC is determined. In theory, a shorter xT would ensure a higher accuracy in handling the horizontal variation. However, on the other hand, it would impede the accurate assessment of dispersion curves. Therefore, it needs to be a trade-off. In most soil-site applications, xT in the range of 10-30 m is most optimal and this gives the optimal dC in the range of 5-15 m.
Once a multiple number (> 5) of records are acquired by regularly moving the source-receiver configuration, one 1-D Vs profile is obtained from each record through surface wave processing. Each Vs profile also has the appropriate horizontal coordinate (i.e., station number) to represent the vertical Vs variation. Naturally, the midpoint of the receiver spread is used for this purpose. Multiple Vs profiles obtained are then used for a 2-D (x and z) interpolation to create the final map. The kriging method is usually used for the interpolation.
Advantages: The MASW technique is the best seismic technique for measuring the modulus of base materials and subgrade material.
Due to multichannel recording and processing schemes employed, results (Vs information) of the survey are highly reliable even under the presence of higher modes of surface waves and various types of cultural noise. For the same reason, the processing steps can be fully automated. Therefore, the method is extremely easy and fast to implement.
Limitations: Due to intrinsic properties of surface waves, resolution of the result is limited by the size of the anomaly. A rule of thumb is that the minimum size that can be resolved is about one tenth of depth.

Figure 82. Overall procedure to construct a 2-D Vs map from a Multichannel Analysis of Surface Waves survey. (Kansas Geological Survey)

Figure 83. Definition of a source-receiver configuration and increment of the configuration.