Basic Concept: Since an air-filled void usually presents a good resistivity contrast with the host rock, resistivity methods can sometimes be used to locate them. However, the voids have to be fairly shallow, maybe within 30 m of the ground surface. This is partly because the electrode array needed to investigate to greater depths becomes excessively long and cumbersome. In addition, being a long array, the resistivity results become influenced by other geological conditions, both along the traverse line and laterally. If the void is filled with water, then its resistivity contrast with the host rocks may be quite small, and may even provide a resistivity low, depending on the salinity or acidity of the water filling the void.
The measurement of resistivity, or more correctly apparent resistivity (since the value read may include several layers each with different resistivities), can be done using four electrodes placed into the ground. The electrodes are simply metal stakes about 0.3 m long that are hammered vertically into the ground. Resistivity readings can be conducted along lines using a constant electrode spacing, forming a traverse of resistivity values, or they can be conducted at one location, taking resistivity measurements using several electrode spacings to form a resistivity sounding. In order to locate cavities, resistivity traverses would be the most appropriate method, although soundings may be needed to find the depth to the cavity. However, instruments are now available that efficiently record resistivity data automatically, allowing resistivity values at several electrode spacings to be recorded along a traverse, thus combining sounding and traverse data. The use of these instruments provides the most appropriate method for locating cavities using resistivity measurements.
Several electrode arrays are used to measure resistivity, and most of the arrays used are illustrated in figure 90.
These arrays are used for different types of resistivity surveys. The Schlumberger array is often used for resistivity soundings, as is the Wenner array. The Pole pole array provides the best signal, but is cumbersome because of the long wires required for the remote electrodes, and it is rarely used. The Dipole dipole array was originally used mostly by the mining industry for induced polarization surveys. Readings were taken using several different separations of the voltage and current dipoles, providing measurements of the variation of resistivity with depth. Long lines of data were recorded requiring many readings. This array has now become common for resistivity surveys using the automated resistivity systems. If more signal (voltage) is needed than can be provided with the dipole dipole array, then the pole dipole array can be used.
Figure 90. Electrode arrays used to measure resistivity.
The electrical current is passed into the ground using two electrodes, and the resulting voltage is measured using the other two electrodes. A geometric factor is calculated for each array and is used in the calculation of apparent resistivity. Resistivity soundings may be useful to find the depth of the bedrock, or to estimate depths to voids or collapse features, and are described here with that purpose in mind. Figure 91 shows the electrode array, the current flow lines (figure 91a), and the resulting sounding curve (figure 91b) over a resistive bedrock. Soundings are conducted by taking measurements at numerous electrode spacings while keeping the center of the array stationary. From these data, a sounding curve is produced (figure 91b).
One of the most commonly used electrode arrays for soundings is the Schlumberger array, which is described here. In this array, the two outer electrodes are used to pass switched current into the ground, and the resulting voltage is measured with the inner two electrodes.
When the electrode spacing (AB/2) is small, the measured resistivity approaches that of the upper layer (layer 1), and when the electrode spacing is large, the measured resistivity approaches that of the lower layer (layer 2, bedrock) (figure 91b). The sounding curve can be interpreted to provide the depth and resistivities of the layers under the sounding site. Resistivity traverses are more commonly recorded using the dipole dipole array, although sounding information is obtained from this array if several dipole separations are used.
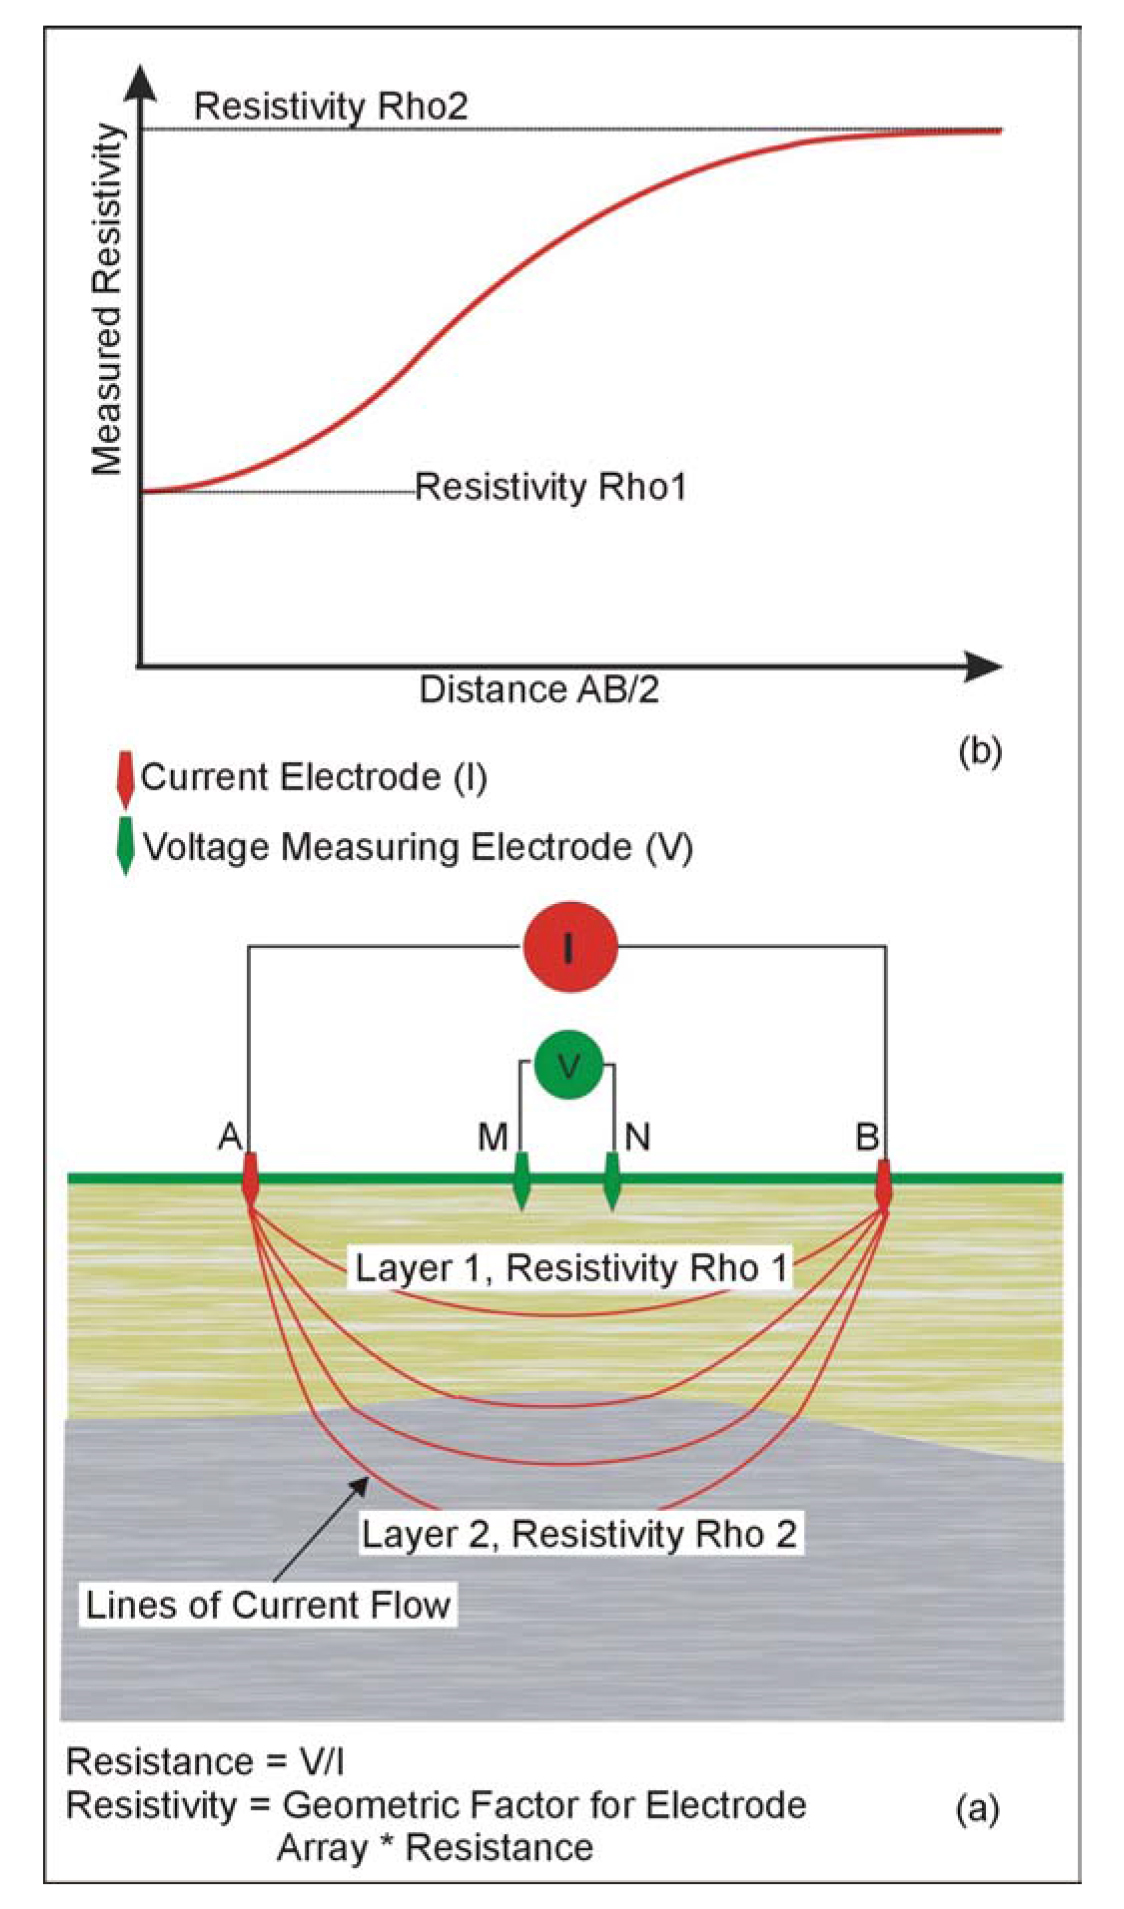
Figure 91. Electrode array for (a) measuring the resistivity of the ground, and (b) a resistivity-sounding curve.
Data Acquisition: Performing a resistivity survey is a moderately labor-intensive procedure, largely because four electrodes have to be inserted into the ground at each station. The first step is to decide the electrode array dimensions to use. This will depend on the depth of investigation and on the geologic section. A resistivity sounding involves taking resistivity readings at different electrode spacings, with the center of the array remaining fixed from which a sounding curve (figure 91b) can be plotted and interpreted. It is advisable to plot the resistivity-sounding curve in the field. If resistive bedrock is expected, then the sounding curve will show increasing resistivities at larger electrode spacings. Before conducting a resistivity survey for cavities, modeling is advantageous to provide the required sensitivity of the method and the best data recording specifications.
If a resistivity traverse is to be recorded, then the dipole-dipole array will probably be used. If several dipole separations are proposed, allowing depth-sounding information to be obtained, then the dipole spacing and the separation of the dipoles need to be evaluated prior to field data recording. A small dipole spacing will provide the best anomaly resolution, but large dipole separations will be required for deep investigations. With small dipoles, only small voltages will be observed at large dipole separations. As with all electrical methods, the resolution of the target decreases with increasing depth.
There are instruments that allow the electrodes to be placed in the ground along a traverse prior to collecting any data. These systems have electrodes that are addressable by the control unit, which is able to automatically set the electrode function, either on/off or a current or voltage electrode. With these systems, a large number of electrodes are connected to the instrument prior to data recording. The electrode array to use, along with the data recording parameters, are entered into the instrument before data recording is initiated. Once data recording begins, the system automatically activates the necessary electrodes for each reading and then takes a reading. It does this for all of the electrodes, making data recording quite efficient. Thus, a large amount of data can be recorded, allowing a correspondingly better interpretation with more resolution. These systems are usually called Automated Resistivity systems. Unlike the resistivity sounding method discussed earlier, these systems are appropriate for the search for cavities. An example of the layout of electrodes for this type of system is shown in figure 92.

Figure 92. Electrode layout for a resistivity survey (Bay Geophysical).
Data Processing: Usually no processing of the data is needed. The resistivity data are plotted to form a pseudosection (figure 93) in which data from small electrode spacings are plotted near the top of the plot (ground surface), and data from the large electrode spacings are plotted some distance vertically beneath the surface line, thus simulating a plot of resistivity against depth for the whole traverse.
Data Interpretation: Interpretation of the data is usually done with resistivity modeling software, which produces a plot of the interpreted resistivity against depth. The resistivity of the cavity and the host rocks determines the expected contrast. Usually, air-filled cavities will have a higher resistivity than the host rocks. However, if the cavity is water-filled, its resistivity may be similar to that of the host rocks, or if the host rocks are resistive or the water in the cavity is saline and, hence, has a low resistivity, the cavity may provide a low-resistivity target.
An example of data from an automated resistivity system is shown in figure 93, illustrating resistivity data across a sinkhole(s). Figure 93 presents three distinct resistivity lows consistent with voids or highly fractured rocks.
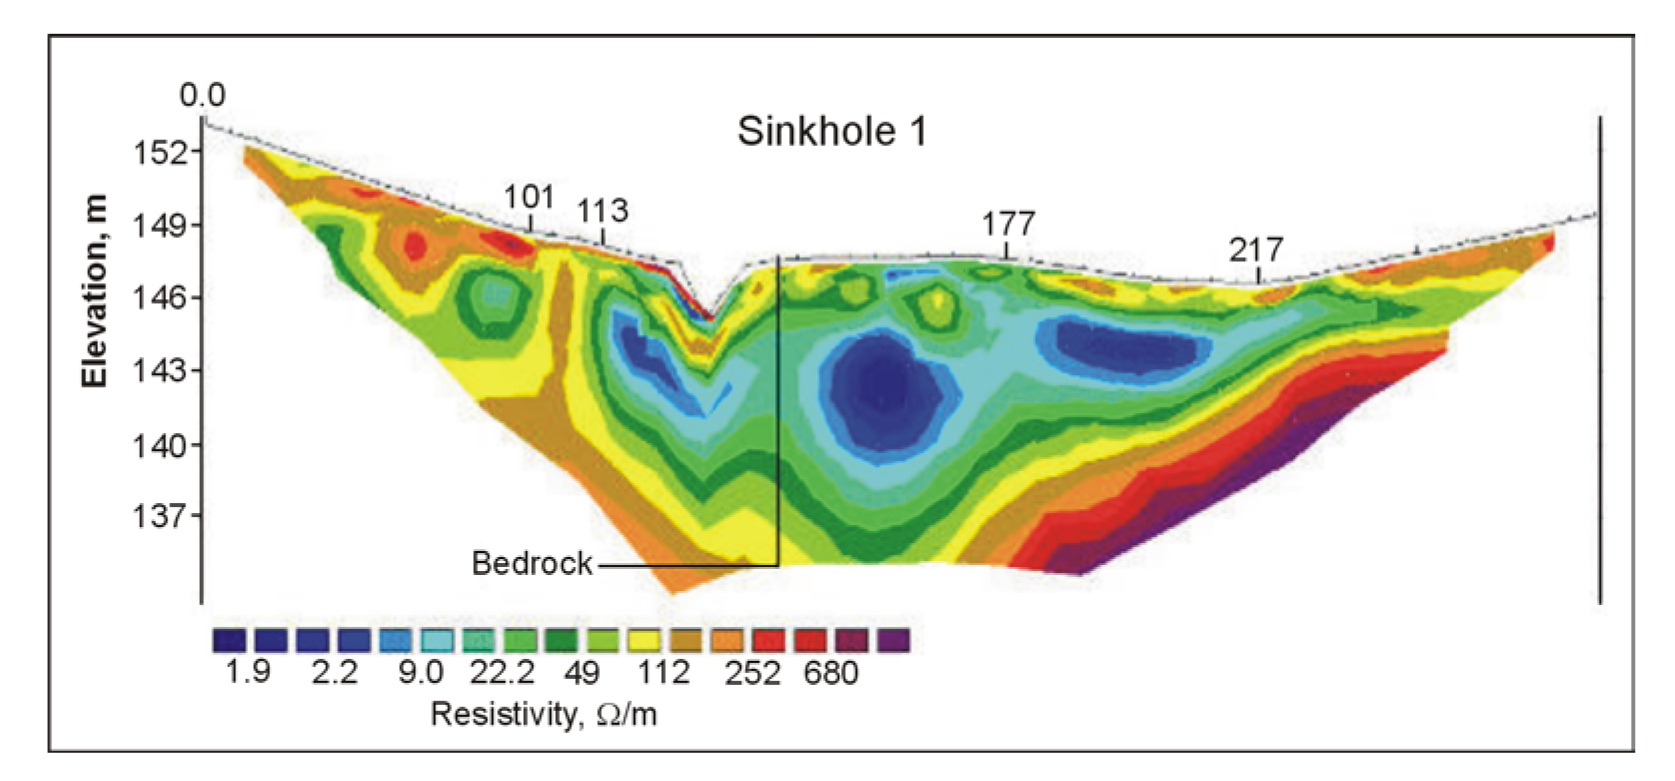
Figure 93. Data from a resistivity survey over a sinkhole plotted as a pseudosection. (Bay Geophysical)
Advantages: Since the resistivity of a cavity is very high, this method can be quite successful at locating cavities if they are large enough compared to their depth.
Limitations: The resistivity method is best suited for finding shallow voids, e.g., those no deeper than 20 or 30 m, depending on the size of the void and the host geology. This is because a long electrode array is needed to search deeper, and such an array is influenced by a large volume of rock and overburden. The influence of the void then becomes relatively quite small. If the host geology is electrically homogeneous, then its influence will be a constant and less of a problem, although the effect of the void is still diluted by larger electrode arrays.
The method is labor intensive in that electrodes have to be planted in the ground along the traverse. The automated resistivity system, in which the instrument automatically records the data while cycling through the required electrode settings, makes resistivity surveys more efficient, allows much more data to be obtained, and results in better interpretation. If the ground is hard, planting the electrodes can be difficult. If the ground is dry or stony, the electrical resistance of the electrode to ground will be very high. In this case, water may have to be poured on the electrodes to reduce this resistance and allow sufficient current to be put into the ground. Any grounded metal fences local to the measuring site will influence the data, and may obscure the desired anomalies. Overhead power lines may induce 60 Hz noise into the data.
If data are obtained along a single line, lateral resistivity variations normal to the line are not accounted for and may introduce errors into the interpretation. However, this can be minimized by recording parallel lines or by recording a three-dimensional resistivity survey.
Seismic methods: Several seismic methods can be used to locate cavities, although some of these methods may only locate the cavity indirectly. For instance, seismic refraction can locate fractured bedrock that may occur above a cavity. Other methods, such as shear waves or Common Offset Surface Waves, attempt to locate cavities directly.